Hurricane Maria Mapping Update
- Subscribe to RSS Feed
- Mark as New
- Mark as Read
- Bookmark
- Subscribe
- Printer Friendly Page
Oct 18 - It has been only a week since we launched the Hurricane Maria Mapping Project and your response has been … amazing! Altogether, over 22,000 building damage interpretations have been contributed since October 11, and the numbers keep growing! In this week, more than 160 teams and individuals have joined.
Interpreting damage through the aerial imagery has been a great learning exercise for all. Here are some interesting scenarios people have run into. (Info below is from the project team.)
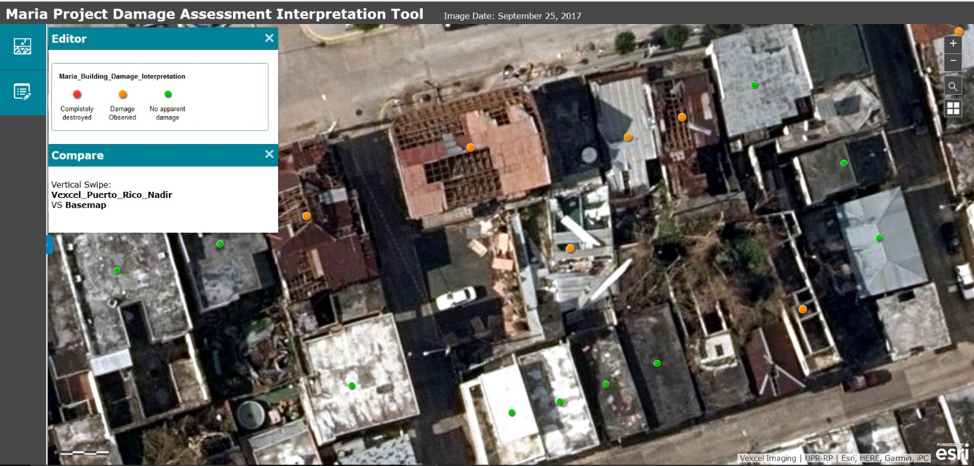
((1))
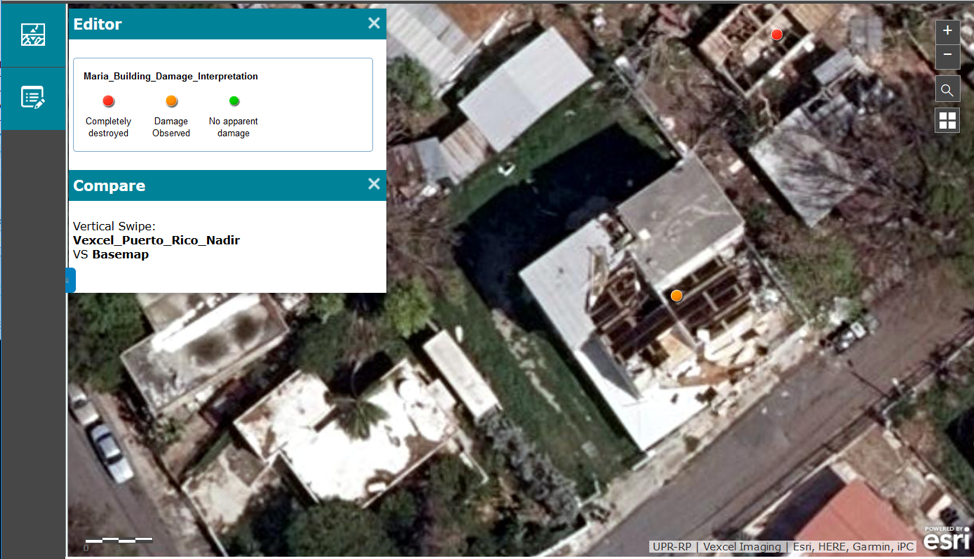
This is a classic ORANGE example (Damage Observed), since the structural damage is obvious. Note how the strong wind literally scrapped out part of the roof. Note that, in this case, we have not marked the building in RED (Completely Destroyed). The difference between Damage Observed and Completely Destroyed is always a bit subjective. It is best to reserve Completely Destroyed for cases where the structure is virtually gone.
((2))
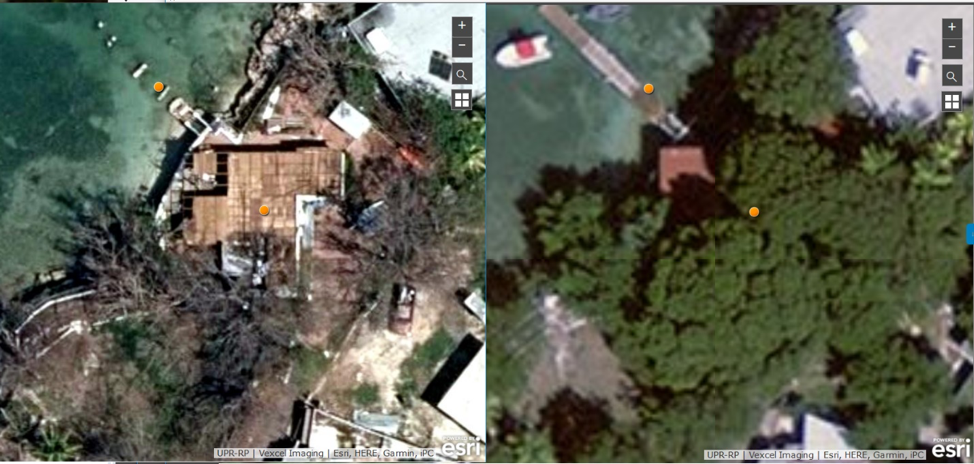
Here is another ORANGE example. The roof has been heavily affected as well, but you can tell the main structure is still standing as proven by the shadow of the building. The trees around the house have been badly hit, but typically that would not count for us as damage, unless it is obvious that the trees have hit the building. In this particular case, it is also interesting to see how the pier has been ripped off. The pier damage has been flagged as ORANGE, although some would argue it should have been RED (Completely Destroyed). The most important thing here is to flag the damage!
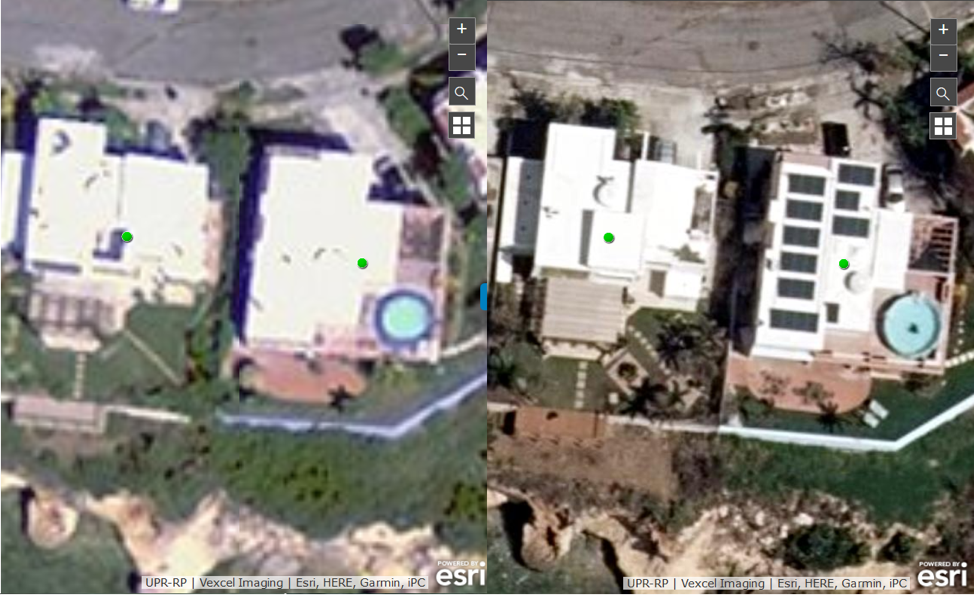
((3))
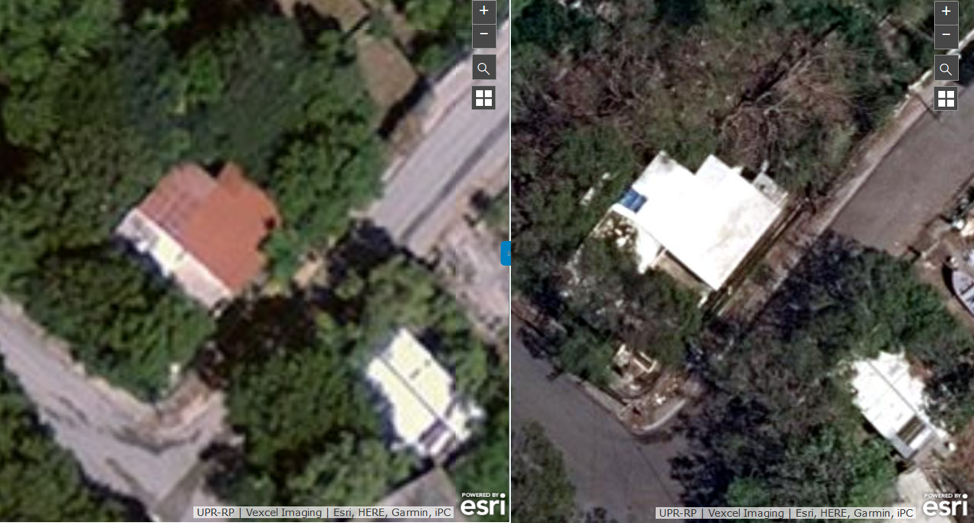
This one is really tricky. First, you can see that the color of the roof is completely different. Before the hurricane it was red, and now it is white? What is going on? Well, a lot could have happened between the time the pre-Maria and post-Maria images were taken. In fact, major transformations in the house could have been undertaken, explaining why the roof is completely different. Now, looking the post-hurricane image, you can tell that the texture of the roof is pretty consistent. It looks like a perfectly fine flat roof, so there are no obvious signs of destruction. Also the fact that there is not a lot of debris around indicates that all these red tiles from the pre-Maria image were probably taken away before the hurricane hit. But wait! There is a small suspicious blue rectangle in there. What could that be? If you have spent enough hours looking at this imagery, you may have seen blue tarps on roofs. This is a good indication of damage (more on this later). However, in this case, we play conservative and leave the building alone; this blue thing could be some sort of roof structure on top of a door to the backyard, some sort of a patio covering may be? Just too difficult to interpret, so we move on and look for more obvious damage somewhere else.
((4))
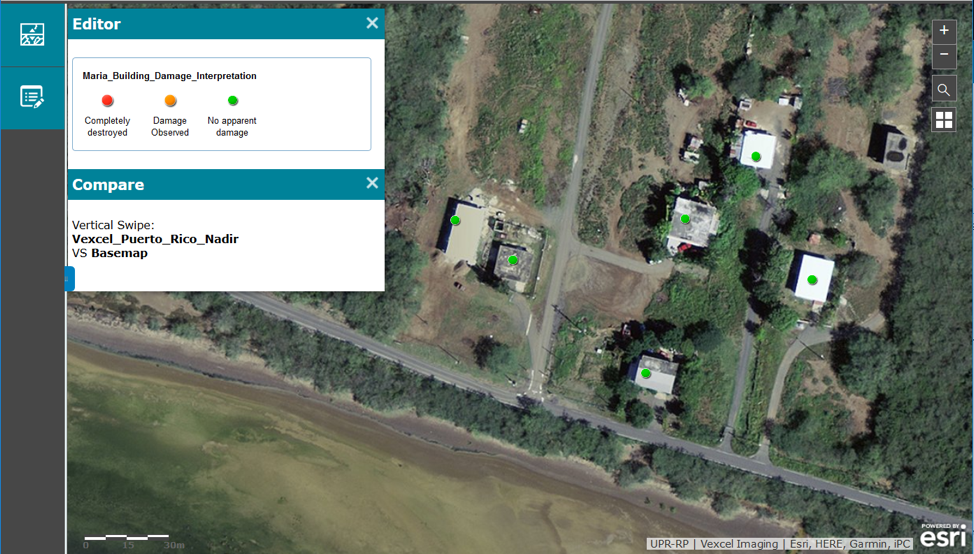
In this screenshot, I am highlighting a plain mistake. Note all buildings are flagged in GREEN, indicating no damage. Indeed, the imagery shows no damage, but please note the imagery is pre-Maria! For this particular area of the island there is no post-Maria imagery. Always use the swipe tool to compare the before and after: if it looks the same… then there may be no recent imagery at all! I left the green dots for the screenshot, but I deleted them right after. Note that for some areas of the island we do not have imagery after the hurricane. These could include highly forested portions of the island, military areas, or portions of the island constantly covered by clouds or islands (like Culebra or Vieques for which we are still waiting for imagery).
((5))
Look at the animation above. What do you think? Is this worthy of RED (Completely Destroyed)? I would personally have categorized this as ORANGE. Particularly the building in the center of the image is a good candidate to leave unflagged. It is certain that vegetation above was severely affected, but there is no obvious evidence of damage to the building itself. It is sometimes just hard to tell from the air.
((6))
Flagging buildings in GREEN indicating that no damage is observed is good practice. Here we have a good example. It is quite difficult, if not impossible, to see all damage in buildings from the air. Someone will need to inspect buildings while onsite, because glass in windows may have broken, or tiles in walls may have been ripped off, but in this case, with the data we have, it is safe to flag thsee buildings in GREEN. There is very minor effect in the vegetation, at least compared with other areas. Note that some Palm Trees are still standing, there is no debris around the house and even the pool looks usable. Another good sign of no damage are the new solar panels installed on the buildings: still apparently intact! There is only north of the pool a small corner of the building where some beams seem to be exposed, but given how well everything seems to be, we would not flag it as damaged: our eyes could be lying here.
((7))
If you are a baseball fan, the above will not look pretty. ORANGE or RED, is your call. To some of you the assessment may be conservative, but let’s do not split hairs on this one. Well done highlighting damage!
((8))
A good example of thorough interpretation. Every building where an interpretation can be made is flagged, leaving only those buildings where a clear assessment cannot be made. Being thorough and at the same time not adding guesses makes the best interpretation.
((9))
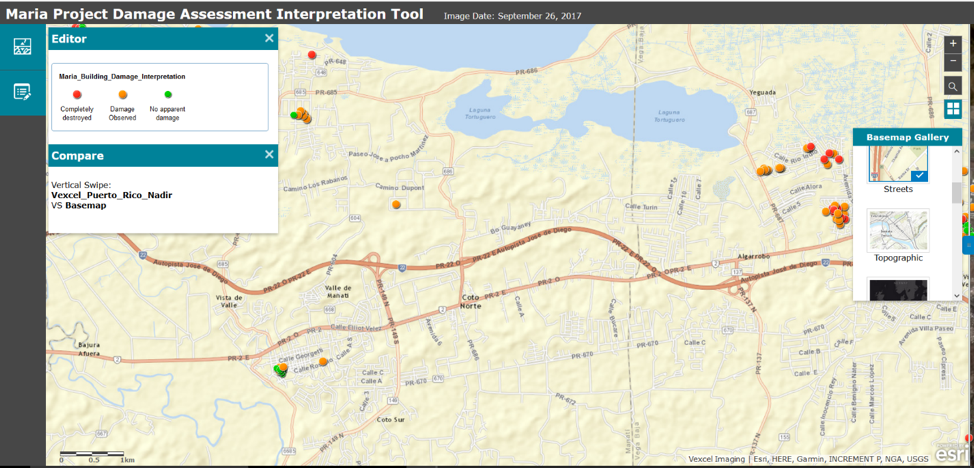
Looking for more? You can use the basemap gallery to temporarily switch to the Streets basemap. This will highlight urbanized areas more clearly so you can focus on areas where no assessments have been made.
You may be wondering about the blue tarps… Did you run into any? I am sure you did! So what about you adding a comment to this blog post with images showing blue tarps? In fact, I encourage you to post comments about situations you have encountered where you need help, or those where you think it is worth sharing!
As we get more damage assessments mapped and we also get better at it, folks in Puerto Rico are getting ready for field validation. We are working with local groups to help contrast the interpreted damage with onsite information. In the meantime, let’s keep up the good work and above everything else, let’s keep learning by doing!
[[Note (Nov.13): Please see blog of Nov.13 adding important context and results.]]
You must be a registered user to add a comment. If you've already registered, sign in. Otherwise, register and sign in.
-
Administration
90 -
Announcements
88 -
Career & Tech Ed
1 -
Curriculum-Learning Resources
288 -
Education Facilities
24 -
Events
78 -
GeoInquiries
1 -
Higher Education
620 -
Informal Education
286 -
Licensing Best Practices
102 -
National Geographic MapMaker
44 -
Pedagogy and Education Theory
243 -
Schools (K - 12)
282 -
Schools (K-12)
311 -
Spatial data
40 -
STEM
3 -
Students - Higher Education
261 -
Students - K-12 Schools
149 -
Success Stories
45 -
TeacherDesk
1 -
Tech Tips
130
- « Previous
- Next »