- Home
- :
- All Communities
- :
- Industries
- :
- Education
- :
- Education Blog
- :
- Examining Change over Time with the Change Matters...
Examining Change over Time with the Change Matters Viewer
- Subscribe to RSS Feed
- Mark as New
- Mark as Read
- Bookmark
- Subscribe
- Printer Friendly Page
Maps as Space-Time Investigative Tools. In this activity, let's use a GIS web mapping application and a wonderful data set at different scales to investigate changes over space and time. Keep in mind that many additional tools and data sets exist. The tool I focus on in this lesson is the Change Matters viewer; it is dependable, I have tested it with teachers and students, it performs well in classroom settings, it uses rigorous methods and a fascinating data set, and using it invites questions, investigation, and problem-solving.
Examining the Earth using different parts of the electromagnetic spectrum.
Geotechnologies include Remote Sensing, which involves taking images of the Earth from a distance, via a satellite, aircraft, Unmanned Aerial Vehicle (or drone), or via other platform. Sensors on the wide variety of satellites orbiting the Earth and even on aircraft or UAVs are sensitive to different parts of the electromagnetic spectrum. Using imagery in remote sensing taken in different parts of the spectrum has many advantages in education, including bridging geography, technology, and science, as well as helping students to understand the utility of remote sensing to understand the Earth in a deeper and more complete way. Similar to how the dentist sees through your cheek to image your teeth using film sensitive to the x-ray wavelengths in the spectrum, we can examine the Earth using different wavelengths.
Investigating change using the Change Matters Viewer
The Change Matters viewer is based largely on Landsat data. Landsat is a series of satellites that have been operated by NASA and the US Geological Survey since 1972. As the name implies, these satellites' mission is to record images not of outer space but of the land—the Earth's surface. They do so in a series of specific bands in the electromagnetic spectrum, many of which feature a combination that results in an infrared image. In an infrared image, healthy vegetation appears red. The infrared imagery also allows for changes to be detected easily on the landscape. As one preface to using the Change Matters viewer, consider spending some time discussing the electromagnetic spectrum with this resource from NASA (https://imagine.gsfc.nasa.gov/science/toolbox/emspectrum1.html) as well as with other resources.
Access the Esri Change Matters site: http://changematters.esri.com/comparehttp://changematters.esri.com/compare
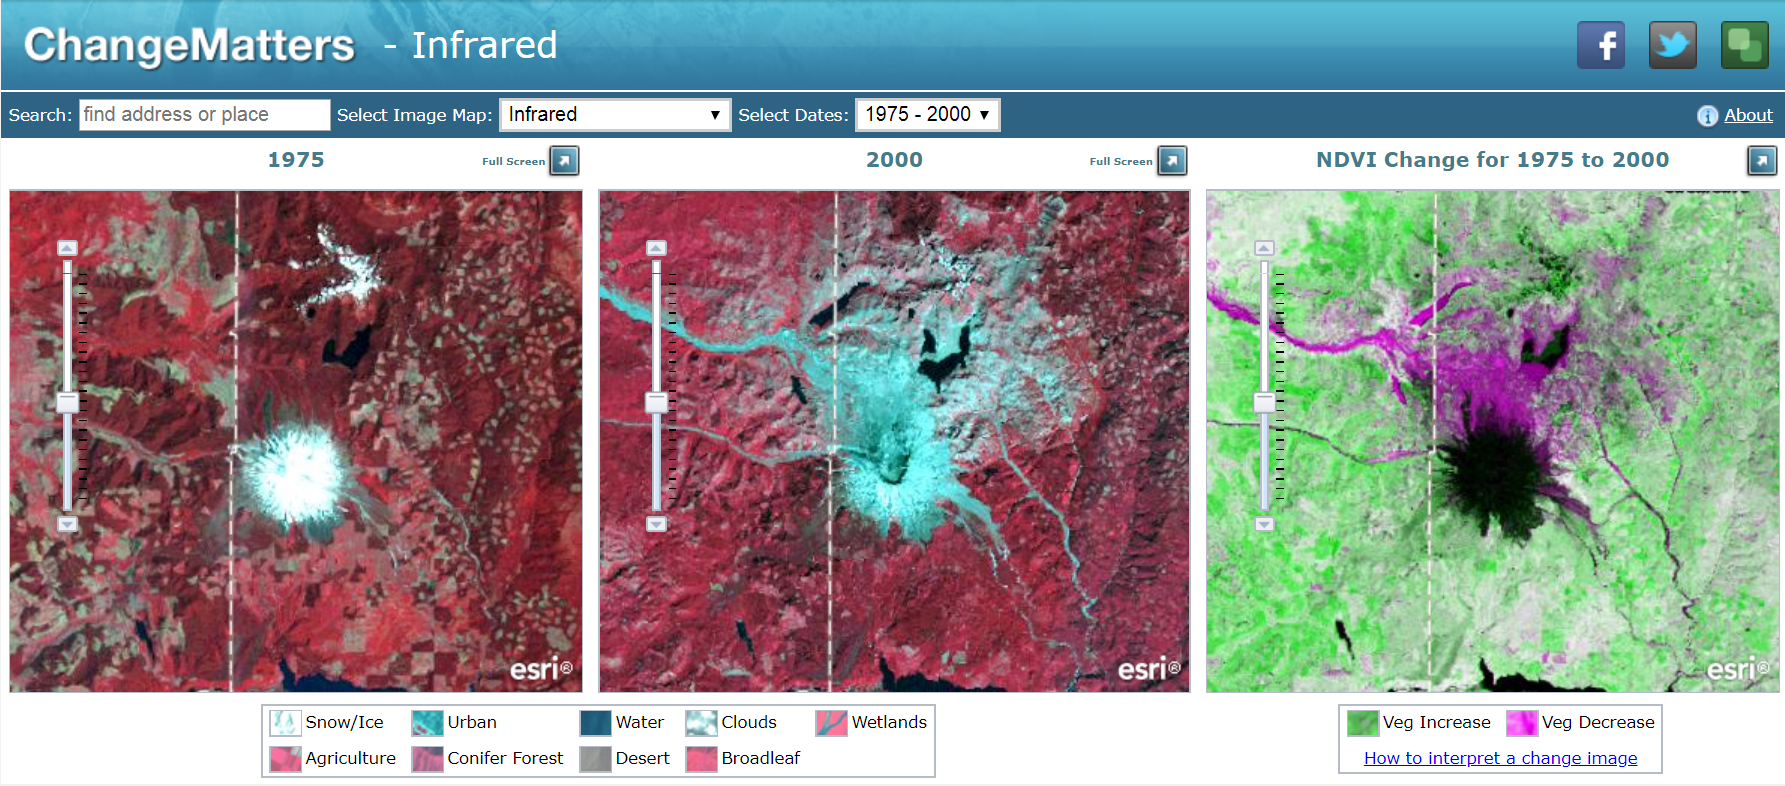
Investigating Mt St Helens. At the time of this writing, the first change matters set of scenes that appears is that of Mt St Helens 1975 and 2000.
Using your skills in spatial thinking, your content knowledge, the information provided in the link at the lower right in the "how to interpret a change image" link, and additional research if you need to, in order to consider the following questions:
What type of landform is this? How do you know?
What substance is represented by the white area that covered the summit of Mt St Helens in 1975?
What year did the first modern-day major eruption occur?
Describe the primary cardinal direction from the volcano’s summit from which the blast occurred. Make sure your students actively use cardinal directions and other spatial terms in their discussions.
Name 2 changes to the landscape between 1975 and 2000 and the reason for those changes.
Change the dates to compare between 1990 and 2010. Note the vegetation increase in the area particularly in the “blast zone” north, northeast, and northwest of the volcano.
Under “Select Image Map”, notice that you can change the image from infrared to four other choices. In the classroom, use these other choices in conjunction with your discussion on the electromagnetic spectrum.
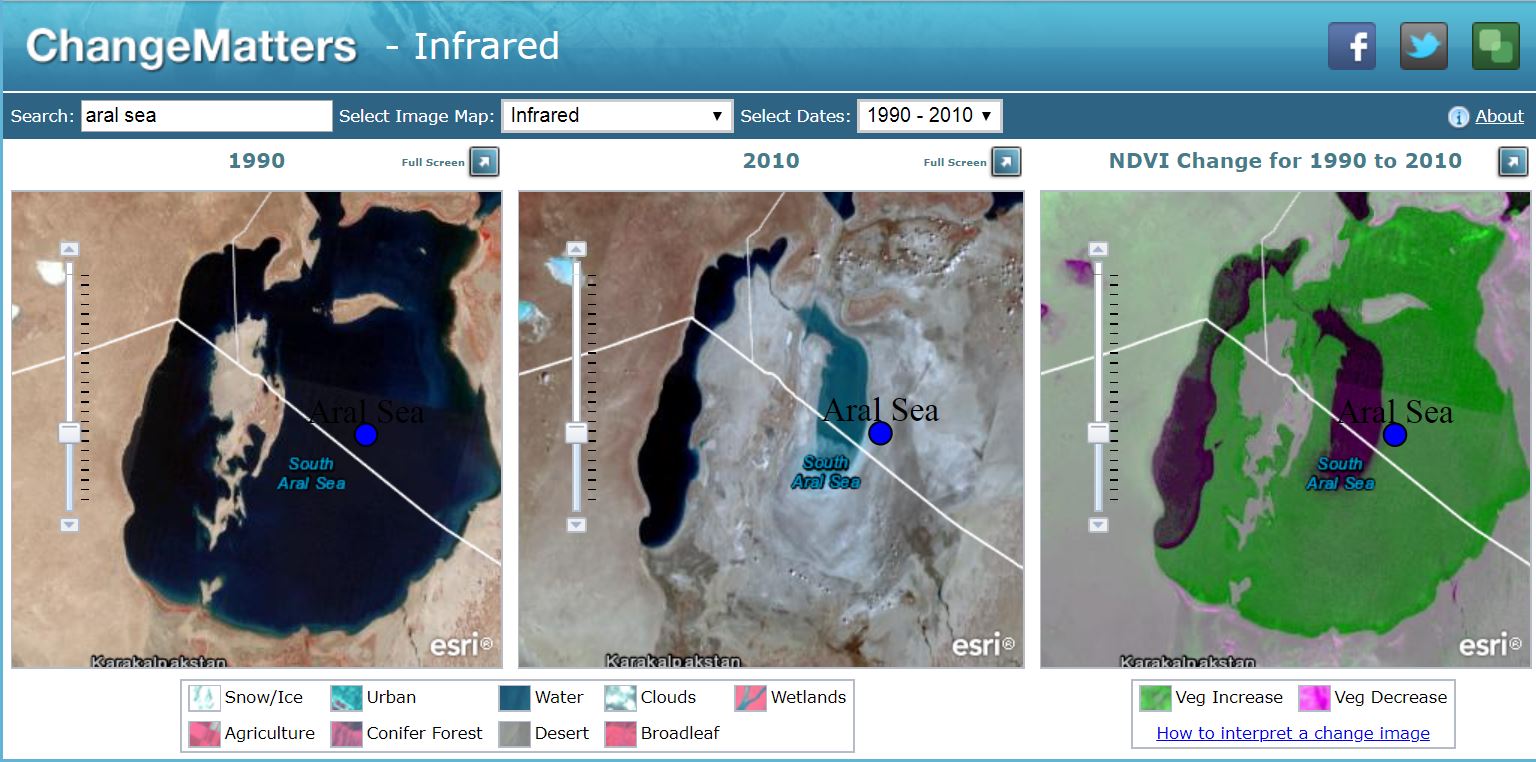
Investigating the Aral Sea. Landsat coverage is global. Using the search box above the images, enter "Aral Sea." Then select Aral Sea as follows:
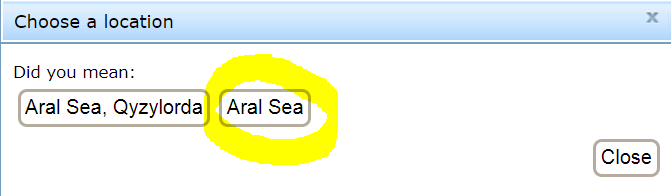
Once the Aral Sea is in your view, zoom to it with the + and – tools or by pressing the shift key while simultaneously dragging a box over the sea. The map will zoom to the area that you define with that box.
The Aral Sea was once the fifth largest lake in the world. Describe 2 changes in the Aral Sea that have occurred over time. Think about our framework of what is there, why is it there, and why should we care: Why should we care if the Aral Sea disappears?
Global attention on the Aral Sea over the past 20 years has increased. Change the dates analyzed to compare 2000 to 2010. Based on the imagery and this tool, would you say that the global attention has slowed the rate of the Aral Sea’s disappearance?
This phrase, “according to this data set” is key when using GIS Technology. Remember, all maps are imperfect—and some are very useful. All of your analysis depends on the data you are using, and thus, repeating this phrase with every new analysis will encourage your students to be critical of and mindful of the data. If time permits, analyze a few additional resources and compare them to whatever data you are analyzing using Spatial Technology.
Zoom out to examine the region covering the Aral Sea. Speculate on the influence that the fact that the Aral Sea lies in two different countries might have on effectively managing it as a resource and to remediate the rate at which it is drying.
Consider asking your students to name one positive impact from human alteration of the Aral Sea, and one negative impact. Why? The Aral Sea’s changes, like so many other issues in geography, is complex: Decisions were made on the landscape, with positive and negative impacts.
Explore Further using the Change Matters viewer. Feel free to examine other places around the world using this Change Matters viewer resource, such as Lake Chad on the Chad-Nigeria-Cameroon border, Las Vegas Nevada USA, development along the Gold Coast of Australia, and elsewhere. As with other Spatial Technologies, the advantage to the Change Matters viewer is that you can investigate a wide variety of issues, themes, and places—all with the same tool.
You must be a registered user to add a comment. If you've already registered, sign in. Otherwise, register and sign in.
-
Administration
90 -
Announcements
88 -
Career & Tech Ed
1 -
Curriculum-Learning Resources
288 -
Education Facilities
24 -
Events
78 -
GeoInquiries
1 -
Higher Education
620 -
Informal Education
286 -
Licensing Best Practices
102 -
National Geographic MapMaker
44 -
Pedagogy and Education Theory
243 -
Schools (K - 12)
282 -
Schools (K-12)
311 -
Spatial data
40 -
STEM
3 -
Students - Higher Education
261 -
Students - K-12 Schools
149 -
Success Stories
45 -
TeacherDesk
1 -
Tech Tips
130
- « Previous
- Next »