- Home
- :
- All Communities
- :
- Industries
- :
- Education
- :
- Education Blog
- :
- Art Meets Business: A new Art-o-Mat site selectio...
Art Meets Business: A new Art-o-Mat site selection lesson that uses Location Analytics
- Subscribe to RSS Feed
- Mark as New
- Mark as Read
- Bookmark
- Subscribe
- Printer Friendly Page
- Report Inappropriate Content
Art-o-mat® machines are retired cigarette vending machines that have been converted to vend art. Yes, it's true! Over 100 active machines already exist in locations throughout the USA! What is the optimal location for an Art-o-mat® machine in central Philadelphia? This new lesson uses location analytics, specifically, ArcGIS Online, a Web-based Geographic Information System (GIS) as a tool for determining these locations. This lesson was created for university students in a visual communications course, but could also be used in business, GIS, sociology, or geography courses and even for students with some GIS skills at the secondary level. The rich and detailed data came from Esri's Business Analyst Web. The lesson focuses on Philadelphia but can be repurposed for any other location. It is yet another example of GIS breaking down traditional disciplinary boundaries--in this case, art and business!
Art-o-mat® machines (courtesy https://www.artomat.org/), are a delightfully funky and creative way of helping students think spatially about site selection, behavior, demographics, and GIS.
The lesson, linked and attached to the business curriculum page, here, can be completed in 3 class periods of 50 minutes each. The technology requirements are minimal, and include (1) A modern edition of a Web browser. (2) A robust Internet connection. (3) A subscription to ArcGIS Online. The lesson can be run in a computer lab setting using equipment provided by the host institution or with students bringing their own devices, or using 1 computer in front of the class with a projector, or in hybrid or fully online courses.
The lesson begins by introducing students to these wonderfully creative repurposed and retro cigarette machines, and then have a class discussion focused on, “What factors are important for locating a good or service? How does the type of good or service influence the factors considered?”
I wrote this lesson after Steve Ryan, Communications professor at Temple University, introduced me to the concept and the idea. The scenario we built for the lesson is as follows: "Hearing about your excellent GIS skills, the Philadelphia Arts Council has hired you to recommend 2 sites in the central part of the city for an Art-o-Mat machine. To understand how GIS has been effectively used in past site selection, read this article describing how PETCO used GIS to improve its store locating decision-making process. Next, learn how other businesses use location analytics via these case studies, here to prepare you for your investigation."
After the students consider what they read in these articles about GIS and businesses, and considering their own previous knowledge, they describe 3 reasons why location is important to business. Next, students access and sign in to Esri’s ArcGIS Online (www.arcgis.com) so that they will be able to optimally locate the machine. Students consider the following 4 behavioral variables:
1. Ordered from Etsy website in the past 12 months.
2. Visited a museum in the past 12 months.
3. Attended an an art gallery in the past 12 months.
4. Did any painting or drawing in the past 12 months.
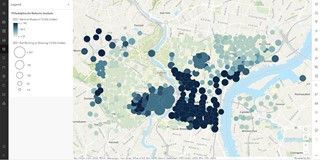
Students open the following web map: Philadelphia Art Behavior Map Starting Point. The map will look similar to that shown in the link above and in the image below, with attendance at an art gallery symbolized in yellow-to-purple tones. I pulled the data from Esri’s Business Analyst Web and saved as a feature service. T
Map of art gallery attendance using ArcGIS Online, central Philadelphia.
The students' task is to use GIS to analyze all 4 of the variables to determine the optimal location for an Art-o-Mat. The students were instructed, "The following tools will be most important in your analysis. However, do not feel confined to only using these. If time permits, you are encouraged to experiment with other tools!"
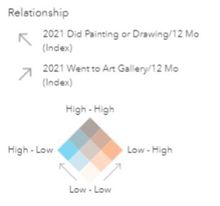
1) Styles: Use styles together with “Fields” to map specific variables. You can add fields to make a bivariate or multi-variate map. You can also make maps showing predominance, relationships (see example above), comparisons, dot density, and others. Under styles you can also change the color, the classification method, and the number of classes. Open the following web map that I created to see an example of a bivariate map: Philadelphia Art Behavior Map. Students are shown how to create a relationship map with the types of variables and classification shown below.
(2) Filter: Use the filter tool to build expressions that allow you to clearly see only those block groups above a certain value for certain variables.
(3) Charts: Creating charts might enable you to rank the neighborhoods and analyze them by attributes.
Students then analyzed each proposed location in detail using a satellite image basemap for additional considerations, such as "Is there a plaza or sidewalk where the machine could be located? What side of such sidewalks or plazas would be best?"
Finally, the students are asked to use ArcGIS Online to create a route for a person visiting their 2 proposed Art-o-Mat locations, and then consider: How long would it take, on foot, for a person to visit both locations?
Students are then asked to add the "Popular Demographics" census data for additional information that might influence their final decision. This could include median age, median income, or other demographic variables. After choosing, mapping, and classifying 2 additional variables, consider how the spatial pattern of these 2 additional variables influenced their final site selection location recommendations. They are cautioned to remember that more data is not always better. Students are asked to consider how the spatial pattern of these 2 additional variables may not have influenced their final site selection.
When the analysis is complete, students are asked to give a live or recorded 5-minute presentation for their peers, instructor, and/or others. To support this presentation, students are asked to use a story map and are provided with instructions on how to make a story map (an example is provided here) that includes the web map of their analysis results.
Love these ideas and want to devote more time to teaching this lesson? One extension to the lesson is to create a 3D scene of the data. Another extension invites students to use Business Analyst Web to map the locations of art galleries, libraries, museums, concert halls, and additional relevant locations: Consider how the proximity of these locations might influence where you might locate the art machines. Create 5-10-15 minute drive time or walk time buffers around these locations to further guide you in your analysis. After mapping these locations and their drive and walk times, consider how the spatial pattern of these drive-and-walk times influenced or did not influence your final site selection location recommendations.
According to their instructor, this activity encouraged students to think spatially and critically, to solve a real-world problem, and to consider how the GIS, or location analytics, could be of great utility to them in their future at the university and beyond, after graduation.
I look forward to your reactions and thoughts!
You must be a registered user to add a comment. If you've already registered, sign in. Otherwise, register and sign in.
-
Administration
38 -
Announcements
45 -
Career & Tech Ed
1 -
Curriculum-Learning Resources
179 -
Education Facilities
24 -
Events
47 -
GeoInquiries
1 -
Higher Education
519 -
Informal Education
266 -
Licensing Best Practices
46 -
National Geographic MapMaker
17 -
Pedagogy and Education Theory
187 -
Schools (K - 12)
282 -
Schools (K-12)
185 -
Spatial data
24 -
STEM
3 -
Students - Higher Education
231 -
Students - K-12 Schools
86 -
Success Stories
22 -
TeacherDesk
1 -
Tech Tips
83
- « Previous
- Next »


