Turn on suggestions
Auto-suggest helps you quickly narrow down your search results by suggesting possible matches as you type.
Cancel
- Home
- :
- All Communities
- :
- Industries
- :
- Education
- :
- Education Blog
- :
- Analyzing the Mean Center of Population for the US...
Analyzing the Mean Center of Population for the USA and States
Subscribe
1321
0
05-27-2011 08:33 AM
- Subscribe to RSS Feed
- Mark as New
- Mark as Read
- Bookmark
- Subscribe
- Printer Friendly Page
- Report Inappropriate Content
05-27-2011
08:33 AM
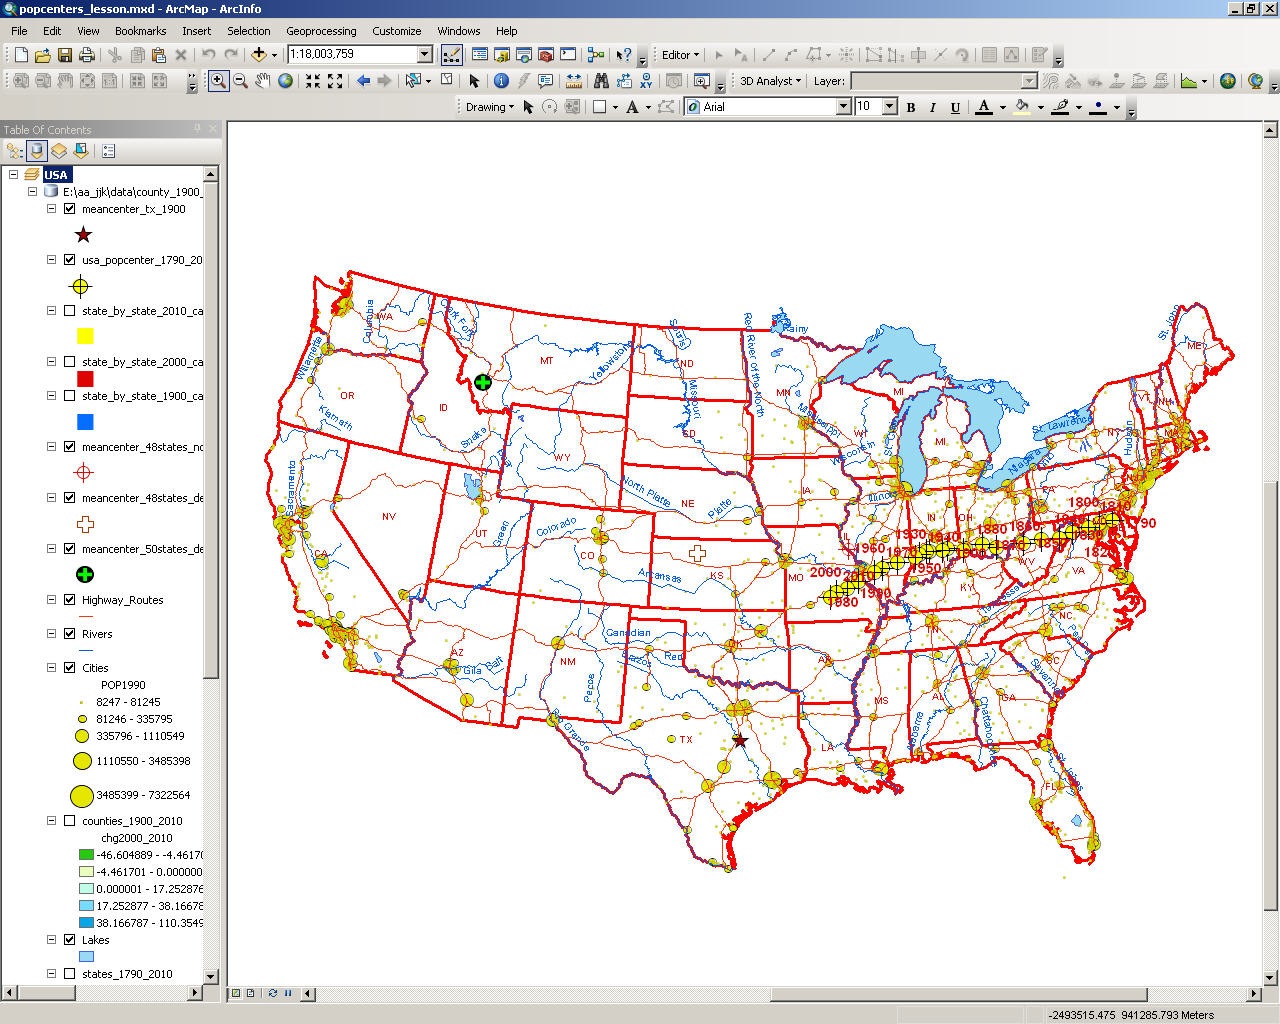
Analyzing the Mean Center of Population for the USA and for Individual States, Updated for ArcGIS 10 and Census Year 2010
A new lesson, entitled “Population Drift: Mean Center Analysis 1790-2010” in the ArcLessons library (search on Population Drift), invites students to use spatial analysis, spatial statistics, and GIS to determine and analyze the population centers of the USA and individual states over space and time, from 1790 to 2010. This lesson was recently updated to include 110 in-depth questions, a very rich set of data including the new 2010 county population figures, and to use the powerful spatial statistics tools in ArcGIS 10.
The objectives of this lesson are to 1) Understand the definition of and application of mean center and weighted mean center; 2) Understand the definition and use of a population weighted mean center in a GIS environment; 3) Learn how to calculate mean population centers for the USA and for individual states using GIS tools; 4) Understand the magnitude and direction of movement and key reasons why the US population center moved from 1790 to 2010; and 5) Analyze how and key reasons why population centers for individual states moved from 1900 to 2010. Skills include calculating mean centers, selecting and using spatial and attribute data, and symbolizing and querying maps. The investigation of population change and population centers naturally lends itself to discussions of job creation and loss, economic conditions, perceptions of place, the evolution of agribusiness and rural outmigration, urbanization, suburban sprawl, sunbelt migration, changes in the median age, changes from industry to services, international migration to the USA, and a whole host of other issues. Examining the population center for individual states allows students to consider how these issues operate on a state scale.
The Census Bureau recently published information on the location of the new 2010 USA center of population, as well as a series of interactive maps showing the 1790-2010 movement, on: http://2010.census.gov/2010census/data/center-of-population.php.
Linked to the page is a series of videos from Census Bureau Director Robert Groves who discusses the movement of the population center. These interactive maps and videos provide excellent supplementary materials to the ArcGIS-based lesson.
How might you use this lesson to teach about the many economic, political, demographic, and perceptual forces operating over the decades?
-Joseph Kerski, Education Manager
You must be a registered user to add a comment. If you've already registered, sign in. Otherwise, register and sign in.
About the Author
I believe that spatial thinking can transform education and society through the application of Geographic Information Systems for instruction, research, administration, and policy.
I hold 3 degrees in Geography, have served at NOAA, the US Census Bureau, and USGS as a cartographer and geographer, and teach a variety of F2F (Face to Face) (including T3G) and online courses. I have authored a variety of books and textbooks about the environment, STEM, GIS, and education. These include "Interpreting Our World", "Essentials of the Environment", "Tribal GIS", "The GIS Guide to Public Domain Data", "International Perspectives on Teaching and Learning with GIS In Secondary Education", "Spatial Mathematics" and others. I write for 2 blogs, 2 monthly podcasts, and a variety of journals, and have created over 5,000 videos on the Our Earth YouTube channel.
Yet, as time passes, the more I realize my own limitations and that this is a lifelong learning endeavor and thus I actively seek mentors and collaborators.
Labels
-
Administration
38 -
Announcements
44 -
Career & Tech Ed
1 -
Curriculum-Learning Resources
178 -
Education Facilities
24 -
Events
47 -
GeoInquiries
1 -
Higher Education
518 -
Informal Education
265 -
Licensing Best Practices
46 -
National Geographic MapMaker
10 -
Pedagogy and Education Theory
187 -
Schools (K - 12)
282 -
Schools (K-12)
184 -
Spatial data
24 -
STEM
3 -
Students - Higher Education
231 -
Students - K-12 Schools
85 -
Success Stories
22 -
TeacherDesk
1 -
Tech Tips
83
- « Previous
- Next »