Defense and Intelligence Blog

cancel
Showing results for 
Show  only  | Search instead for 
Did you mean: 

Latest Activity

(22 Posts)
ShareUser
Esri Community Manager

Intended for database administrators as recommendations for establishing the product workspaces in an Enterprise Geodatabase (Oracle®, SQL Server®, PostgreSQL®).

Read more...

more
0 0 71
ShareUser
Esri Community Manager

Mapping & Charting Solutions (MCS) Enterprise Databases Best Practices

Intended for database administrators as recommendations for establishing the product workspaces in an Enterprise Geodatabase (Oracle®, SQL Server®, PostgreSQL®).

Read more...

more
0 0 50
megan_r
Esri Contributor

When configuring data symbolized using military symbology for use in a web application, you need to consider which client application the data will be consumed in. This article describes how to prepare data for use with military symbology in web applications built using the JavaScript API 4.x for ArcGIS, such as Map Viewer, Dashboards, Instant Apps, and Experience Builder.

Read more...

more
1 0 1,929
megan_r
Esri Contributor

In this exercise, we provide sample data to walkthrough the workflow described in Preparing Data for Use with Military Symbology in Web AppBuilder.  You will prepare and share exercise data that has been symbolized with military symbols for editing in Web AppBuilder (or any web application built using the JavaScript API 3.x for ArcGIS).

Read more...

more
4 0 1,263
megan_r
Esri Contributor

In ArcGIS, military symbology is supported using the Dictionary Renderer. When configuring data symbolized using military symbology for use in a web application, you need to consider which client application the data will be consumed in. This article describes how to prepare data for use with military symbology in web applications built using the JavaScript API 3.x for ArcGIS, such as Web AppBuilder, Map Viewer (Classic), and ArcGIS Dashboards (Classic). 

Read more...

more
2 1 2,074
RicklynHukriede
Esri Contributor

The Esri Federal GIS (FedGIS) Conference is the largest annual meeting of federal government GIS community members. This year's virtual event will offer excellent opportunities to learn, share, and network.

Read more...

more
0 0 721
MatthewWoodlief
Esri Contributor

Esri geographic information system (GIS) technology supports the planning phase of the intelligence cycle with tools that help you understand data collection requirements for current and planned disposition of assets. ArcGIS provides a multi-intelligence environment for integrated collection across all five intelligence disciplines. GIS should be the hub of your intelligence cycle, no matter which "INT" you are interested in. To illustrate just some of the power of ArcGIS, we are going to look at Phase 1: Planning and Direction, as it specifically pertains to foundational geospatial intelligence (GEOINT).

Planning and direction are accomplished through these main responsibilities:
• Identifying intelligence requirements
• Prioritizing intelligence requirements
• Validating the requirements
• Translating requirements into measurables or collectibles
• Preparing collection plans
• Issuing requests for information (RFIs)
• Deciding on a dissemination medium

ArcGIS creates the ultimate advantage by giving you the power to answer the most difficult questions:
• How do I know where to start?
• How do I make sure that what I am collecting is timely and relevant?
• How can I help my team work collaboratively so efforts are not duplicated?
• How can I effectively disseminate the intelligence the team has gathered?

GIS as a System of Record

The use of GIS as a complete system of record allows you to answer these questions more efficiently:
• What datasets do I have?
• Where are they?
• How current are they?
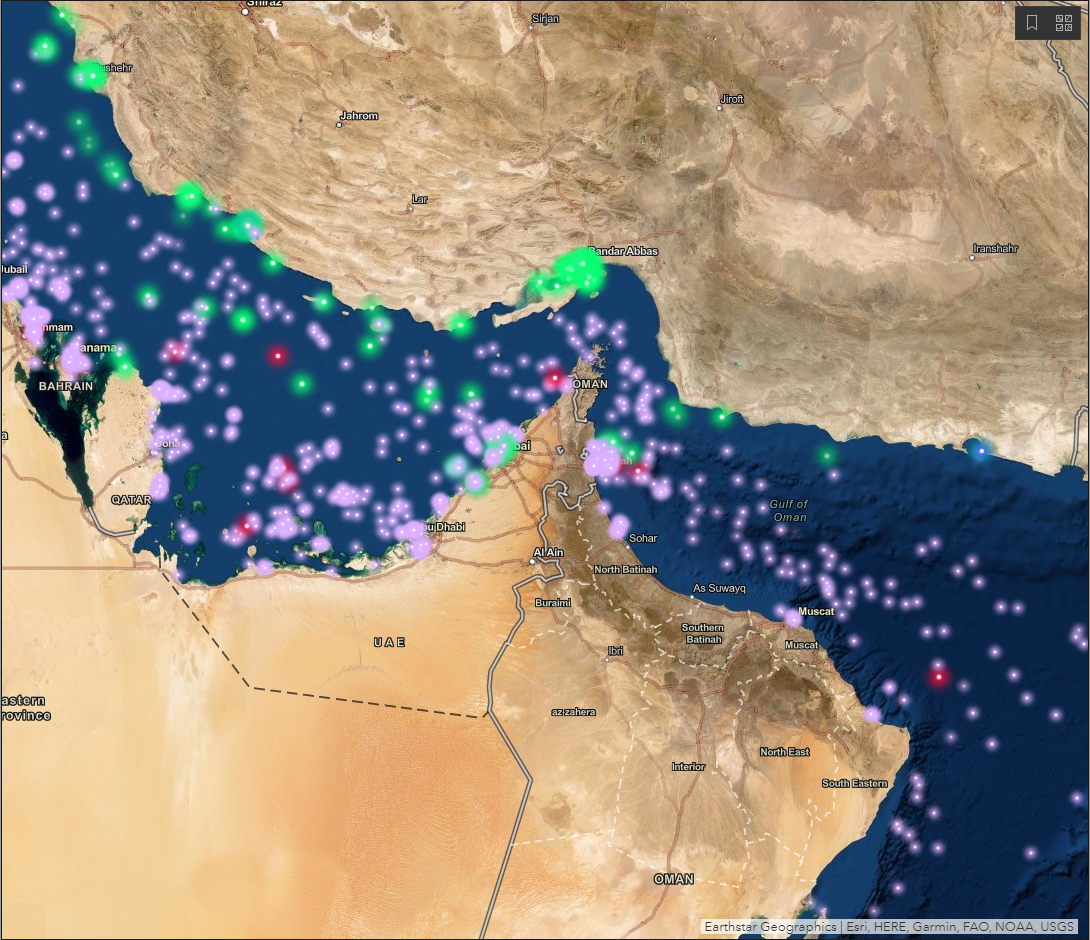
Many agencies see GIS as an analysis or map production tool, and rightfully so. But I want you to start thinking of GIS as a system of record—a fully electronic and searchable system that allows you to quickly answer the questions above. The image below represents the data holdings at many agencies. There is a lot of data—scattered among disparate datasets—and it's hard, if not impossible, to get any real value from it.

The Strait of Hormuz with dots representing ships scattered around.

To illustrate this point further, I'd like to share an anecdote. My role as a data manager was to collect, organize, and deduplicate a client's data holdings. The client was a tech-savvy agency, so when I was told "it's all in shoeboxes," I assumed that meant, at worst, on a hard drive. I walked in the next morning to a big cardboard box brimming with shoeboxes of CDs, DVDs, and some hard drives! It turns out the saying was to be taken literally. This box was the agency's system of record.
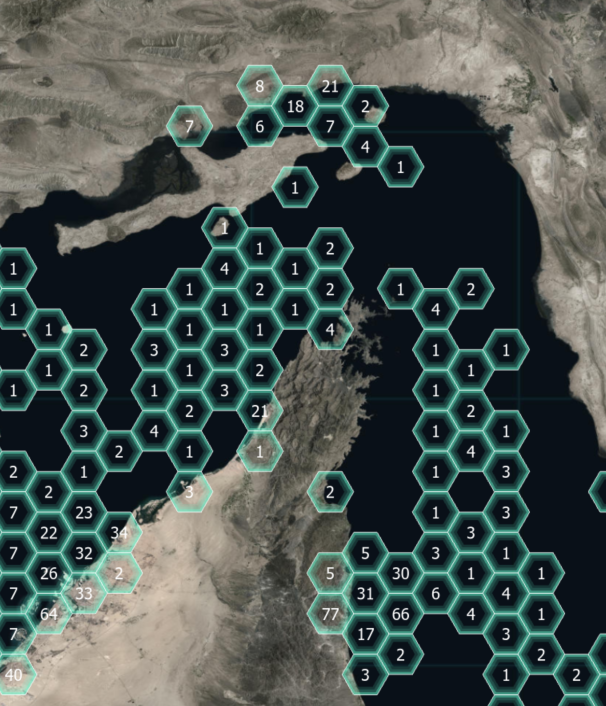
Our solution was to use ArcGIS as the system of record and organize the data holdings spatially. As each dataset was cataloged, it was stamped out according to the boundaries and fed into a database. The boundaries were also updated with attribution; so at the click of a button, we knew what we had, where it was, when it was collected, and how much we had. The illustration below uses hexbins as an abstraction of the concept of spatial cataloging. No matter what boundaries you choose to use, the result is quantifiable, searchable, and actionable information.

The Strait of Hormuz with hexbins representing counts of data holdings

It is much easier now to give direction to the planning stage, as our recommendations are backed by quantified data. Now that we have our system of record set up, let's see how that same system can be used as a planning tool.


GIS as a Collection Planning Tool
Leveraging your GIS gives you powerful capabilities:
• Query your data holdings
• Visualize your data
• Add metadata to clearly denote the currency and authoritative level of the data holdings
• Clearly define your area of interest (AOI)
How do these capabilities help us in this scenario? The planning cycle begins with understanding what you have. By using the querying abilities in your GIS, you can easily find where you have data and then place that data on the map so you know exactly how much coverage you have. The metadata associated with the data holdings is also searchable, so you can determine which areas have holdings that need a refresh. You can also integrate data from other sources, such as conflict data, to narrow and clearly define your area of interest. Your AOI is not just a hunch; it is backed by data and research. This can go a long way in securing funding for your operation and providing justification to your decision-makers.


Conclusion
In this post, we see how ArcGIS as a platform gives you the power to complete many of the phase 1 requirements—all within a single system. You can identify and prioritize your intelligence requirements by aggregating your disparate datasets and query the data to understand which is in the most need of updating. Validating these requirements through visualization techniques to see the holes in your datasets gives you a new perspective on the data holdings, and further justification on where to set collection efforts. You then translate these requirements into specific areas for collection and generation of collection plans based on real-world geographic boundaries. In a future post, we will see how this same system can be used to generate and respond to RFIs and become the dissemination system of choice.

more
3 1 2,409
RicklynHukriede
Esri Contributor


The National Government Team hosts webinars across various industries including Defense,

Intelligence, Mapping, Statistics, Sciences, Civilian Government and Tribal, and Nonprofit and

Global Organizations. The webinar series highlights subjects relevant to your organization's

missions, workflows, and operations.
See all webinars in the series

Explore Ready-to-Use Content in ArcGIS Living Atlas

November 5, 2020 | 10:00 a.m.- 11:00 a.m. (PST)
Esri provides access to a diverse and growing set of content to enrich the ArcGIS user

experience. ArcGIS Living Atlas of the World contains impactful and reliable web maps on many

topics and reflects the collective work of the ArcGIS community. In this webinar, we'll give an

overview of ArcGIS Living Atlas content, how it can be accessed, and how you and your

organization can contribute to it.

Register Here


An Introduction to Infographics in ArcGIS

November 19, 2020 | 8:00 a.m.- 9:00 a.m. (PST)

Infographics are a visually engaging and interactive way to illuminate maps by combining your

data, Esri data, and easy-to-understand graphics. In this webinar, learn how to create beautiful

infographics across the ArcGIS platform. Explore how to build and customize infographics in

ArcGIS Pro or by using multiple web applications such as ArcGIS Business Analyst. Finally, learn

how to share results as interactive exports or by embedding findings in other applications.


Register Here 

more
0 0 768
RicklynHukriede
Esri Contributor

Modernizing National Government with GeoAI and ArcGIS


National government agencies are actively modernizing and automating their workflows to be more efficient and effective. GeoAI leverages artificial intelligence (AI) methods, natural language processing, process automation, staff augmentation, and data mining to extract key information from spatial big data. The use of GeoAI, together with geographic location information and analysis from ArcGIS to mine big data helps government agencies develop effective use of GeoAI and AIM strategies to get required knowledge quickly and with fewer resources.

Key Takeaways

See how to automate workflows using machine learning and computer vision in ArcGIS to quickly solve real-world problems. 

Attendees will learn how to

• Create deep learning training datasets with ArcGIS Pro. 
• Realize the power of the ArcGIS Pro Deep Learning toolset.
• Harness the object detection geoprocessing capabilities in ArcGIS Pro.
• Publish GeoAI geoprocessing services.

What: Modernizing National Government with GeoAI and ArcGIS
Date: Wednesday October 14, 2020
Time: 8:00 a.m. - 9:00 a.m. (PDT)
Where: Webinar Online Registration

more
0 0 427
RicklynHukriede
Esri Contributor

Deliver Analysis-Ready Data 

Government agencies are the authoritative source for creating and collecting data for public consumption.  By making data ready-to-use and more accessible improves how businesses plan their operations, regional governments support their constituents, and how developers build applications for consumers. Enable data consumers to access and incorporate authoritative data, thus giving more meaning to your work. ArcGIS has the capabilities to make data analysis-ready, accessible, and applicable to a variety of applications.  

Key Takeaways

Discover how you can produce and share analysis-ready data using ArcGIS resources like imagery products, ArcGIS Living Atlas of the World, Jupyter Notebook, ArcGIS Hub, and so much more.  Attendees will learn how to

• Incorporate location into their time-series analysis.
• Reduce cycle from data to apps.
• Support evidence-based decision-making.
• Improve your impact by delivering content to 7+ million professionals.

What: Deliver Analysis-Ready Data
Date: Thursday, August 27, 2020
Time: 10:00 a.m. - 11:00 a.m. (PDT)
Where: Webinar Online Registration

more
0 0 406
51 Subscribers
Labels