Turn on suggestions
Auto-suggest helps you quickly narrow down your search results by suggesting possible matches as you type.
Cancel
- Home
- :
- All Communities
- :
- Products
- :
- Data Management
- :
- Data Management Questions
- :
- raster cell outlines from netcdf
Options
- Subscribe to RSS Feed
- Mark Topic as New
- Mark Topic as Read
- Float this Topic for Current User
- Bookmark
- Subscribe
- Mute
- Printer Friendly Page
raster cell outlines from netcdf
Subscribe
1920
2
09-11-2012 12:39 PM
by
Anonymous User
Not applicable
09-11-2012
12:39 PM
- Mark as New
- Bookmark
- Subscribe
- Mute
- Subscribe to RSS Feed
- Permalink
Original User: pfroemke
Hi all,
I am trying to calculate the percent of area in large watershed polygons contributed by each pixel in a netcdf raster. I managed to convert the raster to polygons that show each individual pixel, then I was going to intersect this with my watersheds and calculate the new areas.
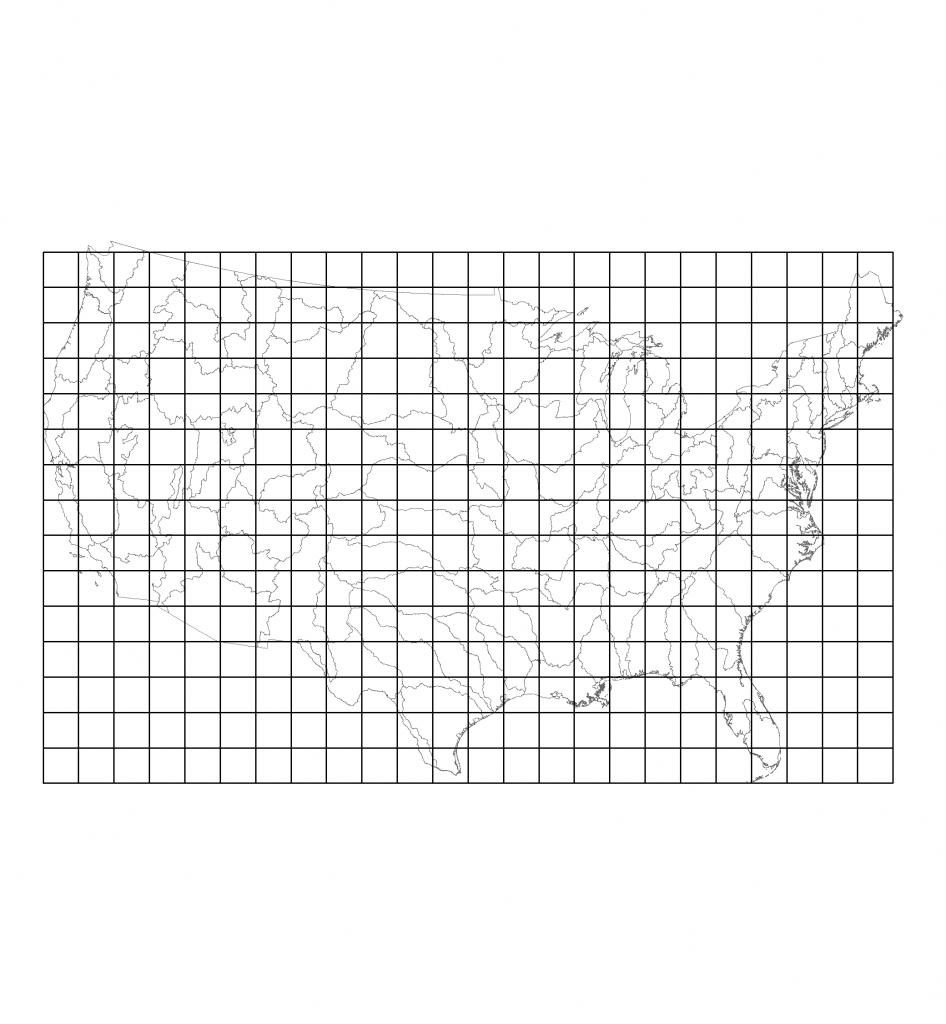
I've attached 2 maps that show what I'm trying to achieve (output from Matlab) and what I'm actually getting. The original netcdf data did not have square pixels, so I had to interpolate to raster from a point feature layer.
Is there an easier way to do this? Are ArcMap 10 and Matlab formats compatible at all? Seems like it should be pretty straightforward.
Thanks!
Pam
Hi all,
I am trying to calculate the percent of area in large watershed polygons contributed by each pixel in a netcdf raster. I managed to convert the raster to polygons that show each individual pixel, then I was going to intersect this with my watersheds and calculate the new areas.
I've attached 2 maps that show what I'm trying to achieve (output from Matlab) and what I'm actually getting. The original netcdf data did not have square pixels, so I had to interpolate to raster from a point feature layer.
Is there an easier way to do this? Are ArcMap 10 and Matlab formats compatible at all? Seems like it should be pretty straightforward.
Thanks!
Pam
2 Replies
09-13-2012
04:33 AM
- Mark as New
- Bookmark
- Subscribe
- Mute
- Subscribe to RSS Feed
- Permalink
Since you have the raster, why not use the Zonal Statistics tool with the watershed polygons? I don't think the intersect of the polygons with each other will get where you need, but the Zonal Statistics as a Table or Tabulate Area.
by
Anonymous User
Not applicable
09-19-2012
07:34 AM
- Mark as New
- Bookmark
- Subscribe
- Mute
- Subscribe to RSS Feed
- Permalink
Original User: pfroemke
That is my problem.....I don't have the raster and so far we've not been able to export it. Another person produced that graphic with Matlab and we've been trying to find a way to do a Matlab export that ArcMap understands. That's why I was trying to reproduce just the "empty" cells in the same size and registration of the Matlab graphic. Not sure I'm going in the right direction with this. I don't know anything about Matlab other than it can export GRIB and HDF raster formats (we haven't had a chance to try yet), which ArcMap says it supports. Another issue I had was that the cells in the original netCDF data were not square, so I had to do all this interpolating to read the data.
That is my problem.....I don't have the raster and so far we've not been able to export it. Another person produced that graphic with Matlab and we've been trying to find a way to do a Matlab export that ArcMap understands. That's why I was trying to reproduce just the "empty" cells in the same size and registration of the Matlab graphic. Not sure I'm going in the right direction with this. I don't know anything about Matlab other than it can export GRIB and HDF raster formats (we haven't had a chance to try yet), which ArcMap says it supports. Another issue I had was that the cells in the original netCDF data were not square, so I had to do all this interpolating to read the data.