- Home
- :
- All Communities
- :
- Products
- :
- Data Management
- :
- Data Management Questions
- :
- How to open Willmott and Matsuura climate data on ...
- Subscribe to RSS Feed
- Mark Topic as New
- Mark Topic as Read
- Float this Topic for Current User
- Bookmark
- Subscribe
- Mute
- Printer Friendly Page
How to open Willmott and Matsuura climate data on ArcMap?
- Mark as New
- Bookmark
- Subscribe
- Mute
- Subscribe to RSS Feed
- Permalink
- Report Inappropriate Content
Hello folks,
I'm in a kind of bad situation and just couldn't find any solution.
So I'm trying to open the "Willmott, C. J. and K. Matsuura (2001) Terrestrial Air Temperature and Precipitation: Monthly and Annual Time Series (1950 - 1999)" dataset, which is avaiable in this link, but I just can't do it on ArcMap. I downloaded 7Zip to un-tar the file (it comes as .tar), but even after uncompressed, each year comes in a .1996, .1997, .1998 and so on format. This leaves me no clue on how to open them in ArcMap.
I am annexing the files so you can take a look.
I really found no way to open them online, I even tried just renaming to a .nc file and them opening with one of the tools in ArcMap, but it just didn't work. Also, I tried to rename them to a .txt format and then just add them to ArcMap. Also didn't work - it was added as an attribute table but it crashed upon opening.
If anyone knows how I can import those files to ArcMap, I'd be very thankful.
Cheers,
Joao
Solved! Go to Solution.
- Mark as New
- Bookmark
- Subscribe
- Mute
- Subscribe to RSS Feed
- Permalink
- Report Inappropriate Content
Holy Xander, I'm speechless. Can't find words to thank you enough. I've tested and it worked, added the other years from the dataset (so now I get 1996-2014).
I only have one last question though; my final objective is to gather data on precipitation for a given Brazilian municipality i in year t. I have two elements: a) points with attributes on monthly precipitation, as well as summary statistics (and which can be turned to rasters with Point to Raster feature), b) a layer composed of polygons, each one representing the area of a given Brazilian municipality, with an attribute table that includes the code of each municipality.
How can I get the data on the rasters (which I can get from the points, as you said above) to the municipalities (polygons), so I get a final table with the code of each municipality and the data on precipitation? Also, as I have noticed from the Point to Raster tool, I need to choose one attribute from the points to become the raster - is it possible I can get all the monthly temperatures to a municipality, not just the mean, or the max/min, each at a time? And is there an easy way to do it for all the 19 years (96-14)? Is it possible to use polygons or should I get the point of the centroid of each municipality and use the Extract Values to Points tool?
Thanks to Dan Patterson as well and to you. If ever in Brazil, I owe you guys some drinks. Or at least a feijoada. Cheers!
- Mark as New
- Bookmark
- Subscribe
- Mute
- Subscribe to RSS Feed
- Permalink
- Report Inappropriate Content
Hi João Francisco Pugliese , first of all I'm glad you could adapt the script and process all the years.
Second of all, thanks for the invite, will keep it in mind, although the feijoada looks promising I´ll settle for some Caipirinhas. 
So first let's have a look at getting all the statistics for each municipality polygon. A municipality will probably be very small and will not have many point in them. To get the data linked to the municipalities you could do a spatial join or union for each year. Doing this for the raster would require the Zonal Statistics (as Table) tool, but as you notice would need to be carried out for each month and each year. This can be scripted, but it might be more effective to use the points instead.
Can you share the polygons (or some polygons) of the municipalities you want to analyze? This way I can see how many points fall inside and what can be done.
The raster data that can be produced by converting each month, could be loaded into a Mosaic Raster Dataset and made time-aware by adding a field with the date for each raster (month).
I'm sure in Brasil there should be information available from meteorological stations that might be more precise and suitable for an analysis at municipality level. This point data should be interpolated to create a raster and that raster could be used to extract the statistics using the Zonal Statistics tool. You would have to repeat this for each month, but this can be scripted or done in ModelBuilder.
Kind regards, Xander
- Mark as New
- Bookmark
- Subscribe
- Mute
- Subscribe to RSS Feed
- Permalink
- Report Inappropriate Content
OK, Xander, caipirinhas it is.
Yes you are right, the municipalities are pretty small, although some are huge. I'm annexing the layer file with the municipalities.
So far I figured out I can use the Sample—Help | ArcGIS for Desktop tool if with centroid points made of each polygon. The data seems to be fine, and one option would be to get one raster for each statistics (either that or the 12 months and I can do the statistics later), use Sample with points and this set of rasters, and then repeat that for each year. Too bad though the Sample command doesn't let me capture the code of each municipality (variable CD_GEOCMU in the point layer). Alternatively to the centroid point, I can get the coordinates from each city town hall, which are made available by the Brazilian Institute of Geography and Statistics.
But I think ideally, because of the larger municipalities, getting the data from rasters to polygons would be better. To that end I tried the Extract Values To Table—Help | ArcGIS Desktop tool, but the data doesn't seem to fit. One municipality is inside a raster with a ~110 mean precipitation and it comes out with ~142 in the table using Extract Values to Table. I'm checking it with the OID* and FID* identifiers from both tables, though I'm not sure they are exactly the same and I could be seeing another municipality (ideally I would like to CD_GEOCMU be used as the identifier variable...). I'm wondering how these tools weight the data though - if a raster cover 40% of the polygon and another covers 60%, will the mean precipitation be the weighted mean of these two rasters?
So these were the two things I tried so far, Sample worked alright for points, EVTT didn't for polygons. The first-best scenario would be getting it from polygons due to big municipalities.
Also, for the data, I'm not sure it is available on a yearly basis - I'm using this dataset because I saw it being used in an economics paper concerning rainfall and child birth in the Brazilian semi-arid. Also, the precipitation variables are to be used as controls in a regression, so they don't need to be exactly perfect, just need to show the heterogeneity in rainfall between municipalities. As I use panel data, that's why I need data on the 19 years.
I'm sending a .lyr file since the .shp was too big to annex.
- Mark as New
- Bookmark
- Subscribe
- Mute
- Subscribe to RSS Feed
- Permalink
- Report Inappropriate Content
Hi João Francisco Pugliese , the layerfile won't be very helpful, since it only contains a reference to the data, but not the actual data itself. You can select a couple of municipalities and export the selection to a new featureclass (file geodatabase o shapeflie) and attach that to the thread to have a look at the data.
- Mark as New
- Bookmark
- Subscribe
- Mute
- Subscribe to RSS Feed
- Permalink
- Report Inappropriate Content
Just downloaded some municipalities for the Bahia area. There are some larger municipalities that have several points inside, but also some that have none:
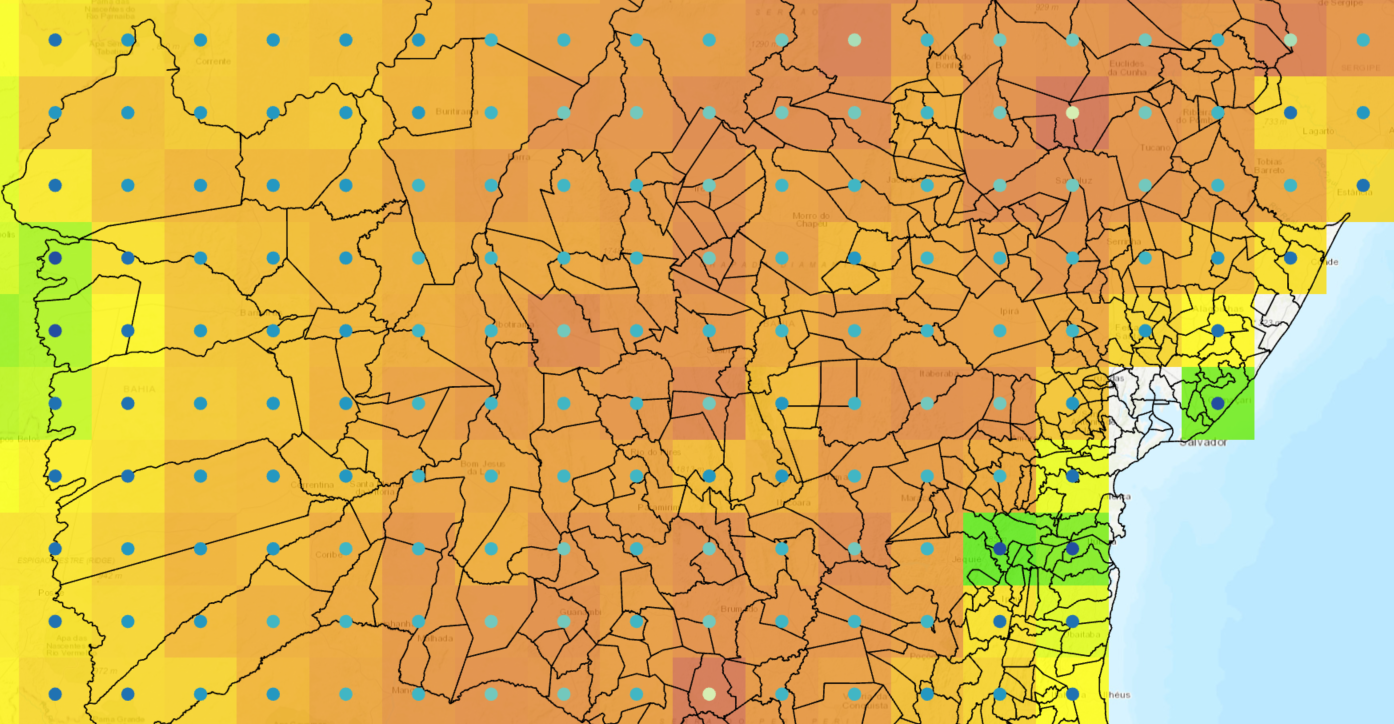
Maybe it would be better to:
- Extract the area for Brazil (point data)
- Determine a cell size that is small enough for each municipality to be represented by one or more pixels
- Interpolate the points to create continuous surfaces, would require you to do this for each attribute (month)
- Extract the data using Zonal Statistics to link stats to municipalities
I really think you will need more detailed climatic data to be able to do something at municipality level: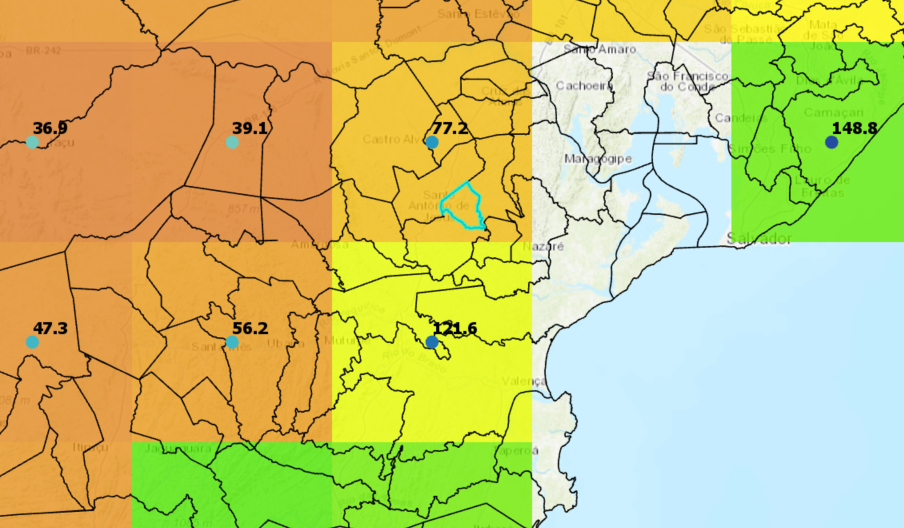
- Mark as New
- Bookmark
- Subscribe
- Mute
- Subscribe to RSS Feed
- Permalink
- Report Inappropriate Content
Hi Xander,
Thanks for providing the code and it was very helpful. While the code you have provided works till 2014, there seems to be some error while applying for the year 2015 onwards. It might be due to some extra information in the ASCII file for 2015-17. Is it possible for you to guide me a bit on that please.
Data can be found here under the name "Terrestrial Precipitation: 1900-2017 Gridded Monthly Time Series (V 5.01) in the following link:
Regards
- Mark as New
- Bookmark
- Subscribe
- Mute
- Subscribe to RSS Feed
- Permalink
- Report Inappropriate Content
Hi shorndrack01 ,
You are right, there is an additional value at the end of the line (I assume that this is the total for the year). You can add an additional line (see line 44) that will strip that value from the list and then it seems to work again:
def main():
import arcpy
import os
sr = arcpy.SpatialReference(4326)
arcpy.env.overwriteOutput = True
# input
years = [2013, 2014, 2015, 2016]
for year in years:
print('year:{}'.format(year))
precip = r'D:\GeoNet\Precip\precip.{0}'.format(year)
# create output fc
print("create output fc...")
fc = r'D:\GeoNet\Precip\test.gdb\precip_{0}'.format(year)
ws, fc_name = os.path.split(fc)
arcpy.CreateFeatureclass_management(ws, fc_name, 'POINT', None, None, None, sr)
print("add fields...")
months = ['January', 'February', 'March', 'April', 'May', 'June', 'July', 'August',
'September', 'October', 'November', 'December', 'Total', 'Mean', 'Min', 'Max']
for month in months:
arcpy.AddField_management(fc, month, 'DOUBLE')
# insert cursor
print("read file and add features...")
cnt = 0
flds = ['SHAPE@']
flds.extend(months)
with arcpy.da.InsertCursor(fc, flds) as curs:
with open(precip, 'r') as f:
report = True
for line in f.readlines():
try:
cnt += 1
if cnt % 10000 == 0:
print(" - processing point {}".format(cnt))
while ' ' in line:
line = line.replace(' ', ' ')
line = line.strip()
lst = line.split(' ')
lst = [float(a) for a in lst]
lst = lst[:-1] # ignore last data on row
pntg = arcpy.PointGeometry(arcpy.Point(lst[0], lst[1]), sr)
lst_row = [pntg]
data = lst[2:]
stats = [sum(data), sum(data) / 12.0, min(data), max(data)]
lst_row.extend(data)
lst_row.extend(stats)
row = tuple(lst_row)
curs.insertRow(row)
except Exception as e:
if report == True:
print(line)
print("{} {}".format(cnt, e))
report = False
if __name__ == '__main__':
main()
- Mark as New
- Bookmark
- Subscribe
- Mute
- Subscribe to RSS Feed
- Permalink
- Report Inappropriate Content
Thanks Xander, you are a lifesaver.
The code works perfectly. Tried finding your email ID from your page, but couldn't.
Is it possible for me to get your work email ID please, if possible.
Regards
- Mark as New
- Bookmark
- Subscribe
- Mute
- Subscribe to RSS Feed
- Permalink
- Report Inappropriate Content
Hi Xander
Hope you are well. I have been trying to adapt your code to perform a similar kind of analysis, but I am meeting some problems. Though the file is being imported in to arcmap the attribute table to the created file has no points it is empty. Could there be something wrong with my code . find my code below and file i am trying to open . Thank you in advance for your help
def main():
... import arcpy
... import os
...
... sr = arcpy.SpatialReference(4326)
... arcpy.env.overwriteOutput = True
...
... # input
... years = [1925]
... for year in years:
... print('year:{}'.format(year))
... precip = r'C:\Users\mi8318ch\Work Folders\Documents\African Economic History Project\Zambia Education Project\GIS Data\Precipitation data\PrecipData\precip.{0}'.format(year)
...
... # create output fc
... print("create output fc...")
... fc = r'C:\Users\mi8318ch\Work Folders\Documents\African Economic History Project\Zambia Education Project\GIS Data\Precipitation data\PrecipData\test2.gdb\precip_{0}'.format(year)
... ws, fc_name = os.path.split(fc)
... arcpy.CreateFeatureclass_management(ws, fc_name, 'POINT', None, None, None, sr)
...
... print("add fields...")
... months = ['January', 'February', 'March', 'April', 'May', 'June', 'July', 'August',
... 'September', 'October', 'November', 'December', 'Total', 'Mean', 'Min', 'Max']
... for month in months:
... arcpy.AddField_management(fc, month, 'DOUBLE')
...
... # insert cursor
... print("read file and add features...")
... cnt = 0
... flds = ['SHAPE@']
... flds.extend(months)
... with arcpy.da.InsertCursor(fc, flds) as curs:
... with open(precip, 'r') as f:
... report = True
... for line in f.readlines():
... try:
... cnt += 1
... if cnt % 10000 == 0:
... print(" - processing point {}".format(cnt))
... while ' ' in line:
... line = line.replace(' ', ' ')
... line = line.strip()
... lst = line.split(' ')
... lst = [float(a) for a in lst]
... lst = lst[:-1] # ignore last data on row
... pntg = arcpy.PointGeometry(arcpy.Point(lst[0], lst[1]), sr)
... lst_row = [pntg]
... data = lst[2:]
... stats = [sum(data), sum(data) / 12.0, min(data), max(data)]
... lst_row.extend(data)
... lst_row.extend(stats)
... row = tuple(lst_row)
... curs.insertRow(row)
...
... except Exception as e:
... if report == True:
... print(line)
... print("{} {}".format(cnt, e))
... report = False
...
... if __name__ == '__main__':
... main()
- « Previous
-
- 1
- 2
- Next »
- « Previous
-
- 1
- 2
- Next »