Turn on suggestions
Auto-suggest helps you quickly narrow down your search results by suggesting possible matches as you type.
Cancel
- Home
- :
- All Communities
- :
- Products
- :
- Data Management
- :
- Data Management Questions
- :
- how to make an address locator for township-range-...
Options
- Subscribe to RSS Feed
- Mark Topic as New
- Mark Topic as Read
- Float this Topic for Current User
- Bookmark
- Subscribe
- Mute
- Printer Friendly Page
how to make an address locator for township-range-section polygons
Subscribe
01-22-2014
07:49 AM
- Mark as New
- Bookmark
- Subscribe
- Mute
- Subscribe to RSS Feed
- Permalink
- Report Inappropriate Content
Hello all,
As stated im having troubles making an address locator to show land ownership
1 company owns 4000+++ peices of land which i have on an excell spreadsheet broken town to Township Range Section
i have the state sections breakdown date
the table looks like this
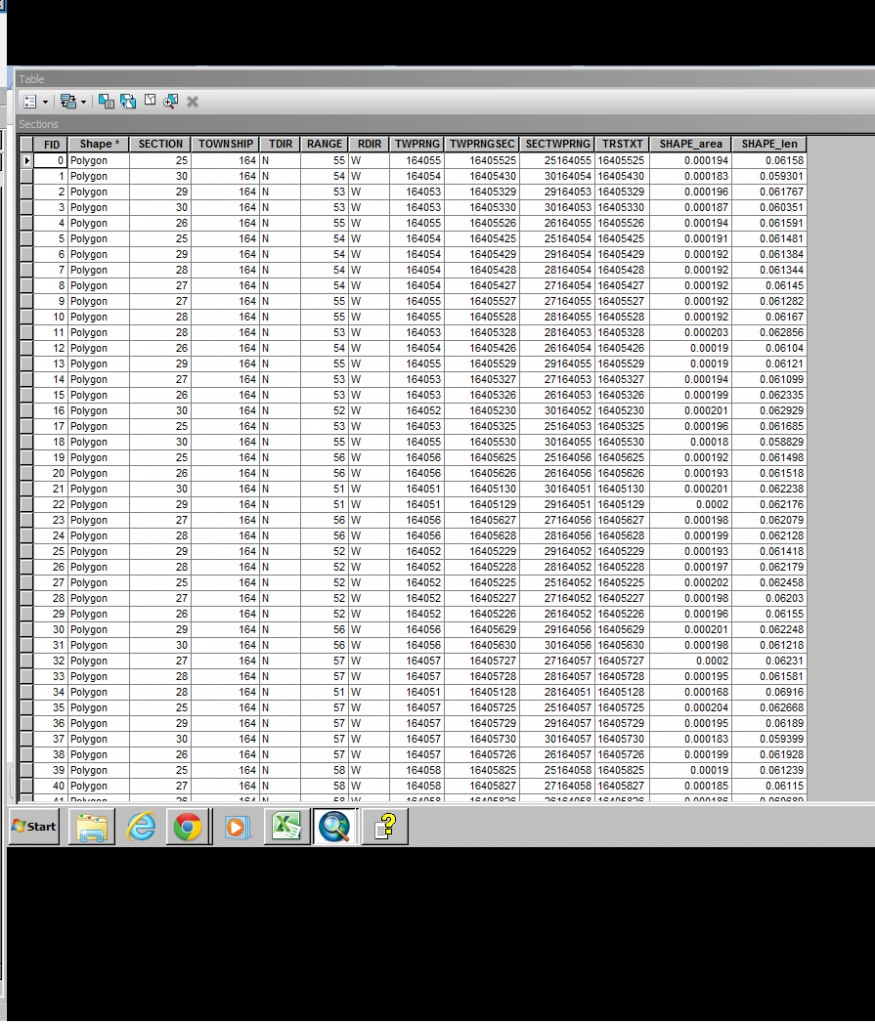
but im stuck at this.
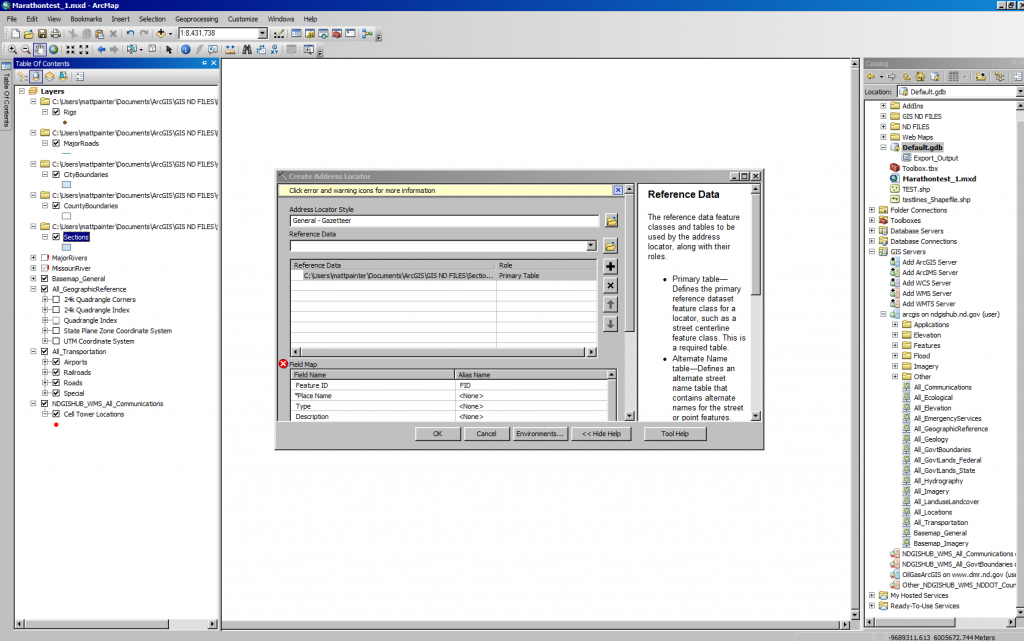
Im guessing i need to add an alia refrence data of my collected data from my spreadsheets but im unsure how to arrange that and if i can just add a excel file
As stated im having troubles making an address locator to show land ownership
1 company owns 4000+++ peices of land which i have on an excell spreadsheet broken town to Township Range Section
i have the state sections breakdown date
the table looks like this
but im stuck at this.
Im guessing i need to add an alia refrence data of my collected data from my spreadsheets but im unsure how to arrange that and if i can just add a excel file
Solved! Go to Solution.
1 Solution
Accepted Solutions
01-23-2014
11:51 AM
- Mark as New
- Bookmark
- Subscribe
- Mute
- Subscribe to RSS Feed
- Permalink
- Report Inappropriate Content
The new ownership shows up but doesnt display on the map?
is there a setting im unaware of?
Now that you have a successful join you have to use the joined fields to change the layer properties to use them. You could change the Label tab settings to display owner names from the joined fields or you could change the Symbology tab settings to show different fill or outline colors or hatch symbols based on different ownerships using a Categorized symbol legend list. Your owner table is only township/range/section data, which the Section table already had. So the owner table may needs more fields about the owners to be useful for making the layer show ownership information.
Since the ownership was all for one company then you could make the Symbology Categories only show NULL values in the list for the TWPRNGSEC field with a background symbol for that value, and then assign a fill symbol intended for your company to the All Other Values option and rename that option with the Company name. You would have to have a field that had the company name in every record of the Company table to make the symbology work where the category list has the company name and the All Other Values option is showing a background symbol for lands not owned by the company.
Or else you could make a simple fill symbol for the whole layer and set a Definition Query tab to:
NOT JoinTable.TWPRNGSEC IS NULL
JoinTable is just a dummy name value. Use the field list to substitute the actual qualified join field name in the expression from the Joined table. This will filter the layer to only show sections that are actually in the table that the company owns. Then you would have to have the map showing an area where the company owns some sections and does not own other to see the full effect of those symbology settings. You could optionally use that expression to select company owned Sections with a Select By Attributes query also.
21 Replies
01-22-2014
08:08 AM
- Mark as New
- Bookmark
- Subscribe
- Mute
- Subscribe to RSS Feed
- Permalink
- Report Inappropriate Content
You only showed the Section table. Show the relevant Section Township and Range fields of the Owner data that could match that.
I would not bother with an address locator at all. I would do a standard concatenation of the section fields to form a single string uniquely describing each section and create a Join/Make Query Table merge of the two datasets.
I would not bother with an address locator at all. I would do a standard concatenation of the section fields to form a single string uniquely describing each section and create a Join/Make Query Table merge of the two datasets.
01-22-2014
08:27 AM
- Mark as New
- Bookmark
- Subscribe
- Mute
- Subscribe to RSS Feed
- Permalink
- Report Inappropriate Content
You only showed the Section table. Show the relevant Section Township and Range fields of the Owner data that could match that.
I would not bother with an address locator at all. I would do a standard concatenation of the section fields to form a single string uniquely describing each section and create a Join/Make Query Table merge of the two datasets.
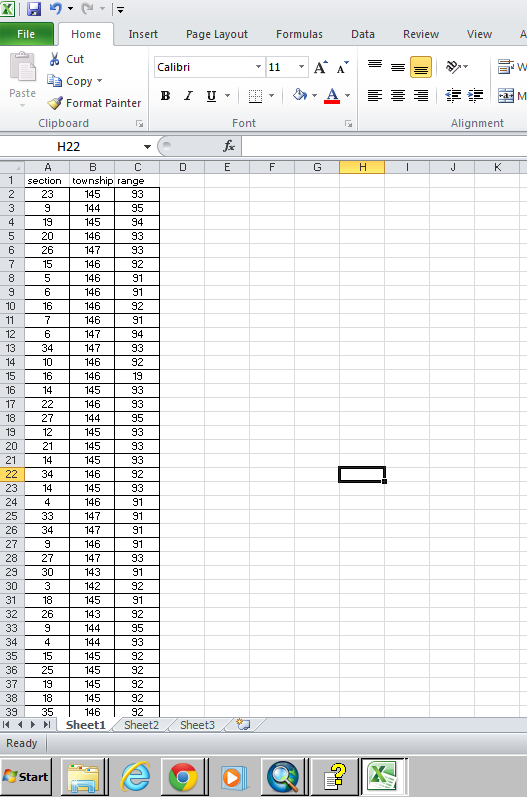
this is a shot of some of the data i have
alright how do i join to two tables together?
explain it idiot proof for me 🙂
01-22-2014
09:14 AM
- Mark as New
- Bookmark
- Subscribe
- Mute
- Subscribe to RSS Feed
- Permalink
- Report Inappropriate Content
alright how do i join to two tables together?
explain it idiot proof for me 🙂
I assume all Townships are North in your jurisdiction and all Ranges are West for your ownership data and in your jurisdiction. So you would only need to deal with the numbers. This is shown in the TwpRngSec field of your Sections table with a value like 16405525. Check if that column is a text field or a number field.
Add a column header in the next empty column of your ownership table named TwpRngSec (in cell D1). To make a text value in your owner table that would match the value in that same column in the Section table you would add a formula to cell D2 that reads:
=CONCATENATE(IF(B2<100,"0",""),IF(B2<10,"0",""),B2,IF(C2<100,"0",""),IF(C2<10,"0",""),C2,IF(A2<10,"0",""),A2)
If the value that appears is 14509323 the formula worked. Copy that formula down to the bottom of the table (double click the cell corner).
This formula should work for all Townships from 1 to 999, all Ranges from 1 to 999 and all Sections from 1 to 36 (and technically also up to 99).
The Excel table can be joined on the column named TwpRngSec to the field named TwpRngSec in the Section table provided it is imported into ArcMap with field type that is compatible with the one used in the Section table. Or else join it to the TRSTXT field if it imports as text.
Do not use the Excel table directly for the join. Import it to a File Geodatabase table or a dbase table. (I always use File Geodatabase Tables and Feature Classes and hate shapefiles). If the relationship is one to many (one section has many owners) you need to import both the owner table and the Section shapefile into the same File Geodatabase to use the Make Query Table too correctly.
01-22-2014
09:39 AM
- Mark as New
- Bookmark
- Subscribe
- Mute
- Subscribe to RSS Feed
- Permalink
- Report Inappropriate Content
I assume all Townships are North in your jurisdiction and all Ranges are West for your ownership data and in your jurisdiction. So you would only need to deal with the numbers. This is shown in the TwpRngSec field of your Sections table with a value like 16405525. Check if that column is a text field or a number field.
Add a column header in the next empty column of your ownership table named TwpRngSec (in cell D1). To make a text value in your owner table that would match the value in that same column in the Section table you would add a formula to cell D2 that reads:
=CONCATENATE(IF(B2<100,"0",""),IF(B2<10,"0",""),B2,IF(C2<100,"0",""),IF(C2<10,"0",""),C2,IF(A2<10,"0",""),A2)
If the value that appears is 14509323 the formula worked. Copy that formula down to the bottom of the table (double click the cell corner).
This formula should work for all Townships from 1 to 999, all Ranges from 1 to 999 and all Sections from 1 to 36 (and technically also up to 99).
The Excel table can be joined on the column named TwpRngSec to the field named TwpRngSec in the Section table provided it is imported into ArcMap with field type that is compatible with the one used in the Section table. Or else join it to the TRSTXT field if it imports as text.
Do not use the Excel table directly for the join. Import it to a File Geodatabase table or a dbase table. (I always use File Geodatabase Tables and Feature Classes and hate shapefiles). If the relationship is one to many (one section has many owners) you need to import both the owner table and the Section shapefile into the same File Geodatabase to use the Make Query Table too correctly.
alright i believe i did everything you said
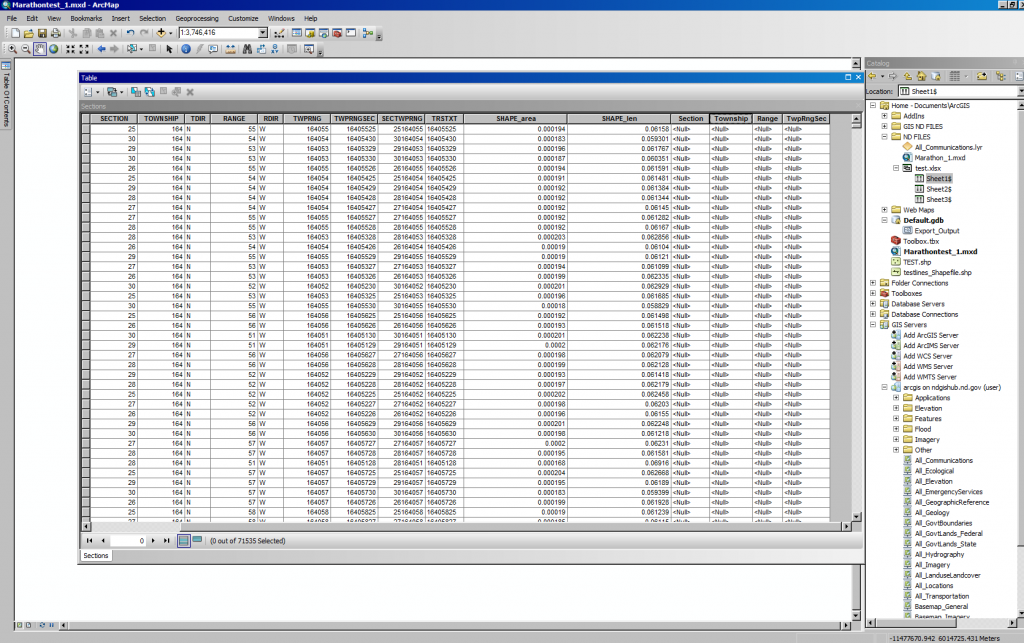
but when i joined it my table shows up on the end as shown in the photo but doesnt so anything?
01-22-2014
10:43 AM
- Mark as New
- Bookmark
- Subscribe
- Mute
- Subscribe to RSS Feed
- Permalink
- Report Inappropriate Content
alright i believe i did everything you said
but when i joined it my table shows up on the end as shown in the photo but doesnt so anything?
You did not import the Excel table, otherwise it would have an FID or ObjectID field. I don't use Excel for joins ever, because Excel spreadsheets are not really tables with defined field types and it rarely works. I am also not sure you can join to an Excel formula field ever, since it does not really store the value it shows.
Create a File Geodatabase and import (or export) the Excel spreadsheet to it before joining it. Also convert your Section Shapefile to the File Geodatabase as a Feature Class (right click it in catalog and choose data export into the file geodatabase by making sure the type of target is a geodatabase at the bottom of the dialog). Performance will improve and memory faults like you are seeing will be avoided. Before Joining make sure the owner field is numeric if you are joining to the TwpRngSec field of the Sections. If it imports as text join it to the TRSTXT field. Get used to using File Geodatabases if you want to do professional GIS work.
Do you know if more than one owner is associated to any given section ever? If that type of relationship exists a join will not work to show you all of the owners, only one of them. To see all of the owners you would need to use the Make Query Table Tool. If only one owner is associated to a Section the regular Join is fine.
I am not really sure what your owner table does for you, since it only has township information and no owner names or IDs to group or symbolize on.
01-22-2014
11:09 AM
- Mark as New
- Bookmark
- Subscribe
- Mute
- Subscribe to RSS Feed
- Permalink
- Report Inappropriate Content
Keep in mind the Join or Make Query Table will end up creating polygons, while the Address Locator option would create points. The effects you can do when overlapping of multiple ownerships per section occurs will differ. With Polygons you would have to use open hatched symbology with a variety of hatch patterns and different outline widths and colors to make them all visible on the map. With points you could do dispersion techniques. So choose the approach that ends up showing the effect you want. Either way the TwpRngSec field will let you do the Join or Locator.
01-23-2014
07:55 AM
- Mark as New
- Bookmark
- Subscribe
- Mute
- Subscribe to RSS Feed
- Permalink
- Report Inappropriate Content
Alright so i did what you said by making a file gdb and importing my data to it.
I added to the map and i did the join although my data shows up as <null> whats this mean? did i do something wrong?
I added to the map and i did the join although my data shows up as <null> whats this mean? did i do something wrong?
01-23-2014
08:03 AM
- Mark as New
- Bookmark
- Subscribe
- Mute
- Subscribe to RSS Feed
- Permalink
- Report Inappropriate Content
also wont let me alter the data time in the tables properties
01-23-2014
08:17 AM
- Mark as New
- Bookmark
- Subscribe
- Mute
- Subscribe to RSS Feed
- Permalink
- Report Inappropriate Content
Alright
so i uploaded the table how you meantioned into a new file gdb to work from i included a column for ownership and a column thats the same as in my sections table and the formula looks like it matches up... cool beans
when i imported the sections to my gdb as a feature class it seems like it screwed up some settings as you can see it fully shades my map? but skimming through properties its identical to the original??? whats the cause of this?
alright now to join it finally... am i missing the simplicity of this project and making it harder than it is...
here i join it although it doesnt list the corresponding column on my table??? why is this?
For the Sections shading I am not sure what occurred. I would check the Source tab of the layer properties and verify that it is the same Coordinate system as the original. Also test altering the Symbology tab setting. It does not look like it matches the symbology in the legend, so we want to make it match that symbology. For the export did you right click the Sections shapefile and use the Data Export to Single Feature Class option?
For the second, probably the formula did not export. You will have to convert the formula to actual values. To keep your original data with the formulas select everything on the page and then use the Paste Special - Values Only on a new tab of the Spreadsheet to convert the formula to value. Then retry the export/import of the Excel table using the second sheet.
Lets forget about the time format issue until the normal layer behavior for drawing and joining is solved.