- Home
- :
- All Communities
- :
- Products
- :
- Data Management
- :
- Data Management Questions
- :
- How to Append Multiple Viewsheds into One Table Us...
- Subscribe to RSS Feed
- Mark Topic as New
- Mark Topic as Read
- Float this Topic for Current User
- Bookmark
- Subscribe
- Mute
- Printer Friendly Page
How to Append Multiple Viewsheds into One Table Using Model Builder?
- Mark as New
- Bookmark
- Subscribe
- Mute
- Subscribe to RSS Feed
- Permalink
- Report Inappropriate Content
Hello,
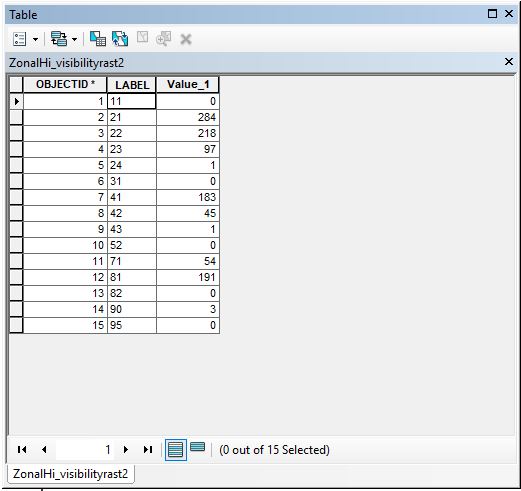
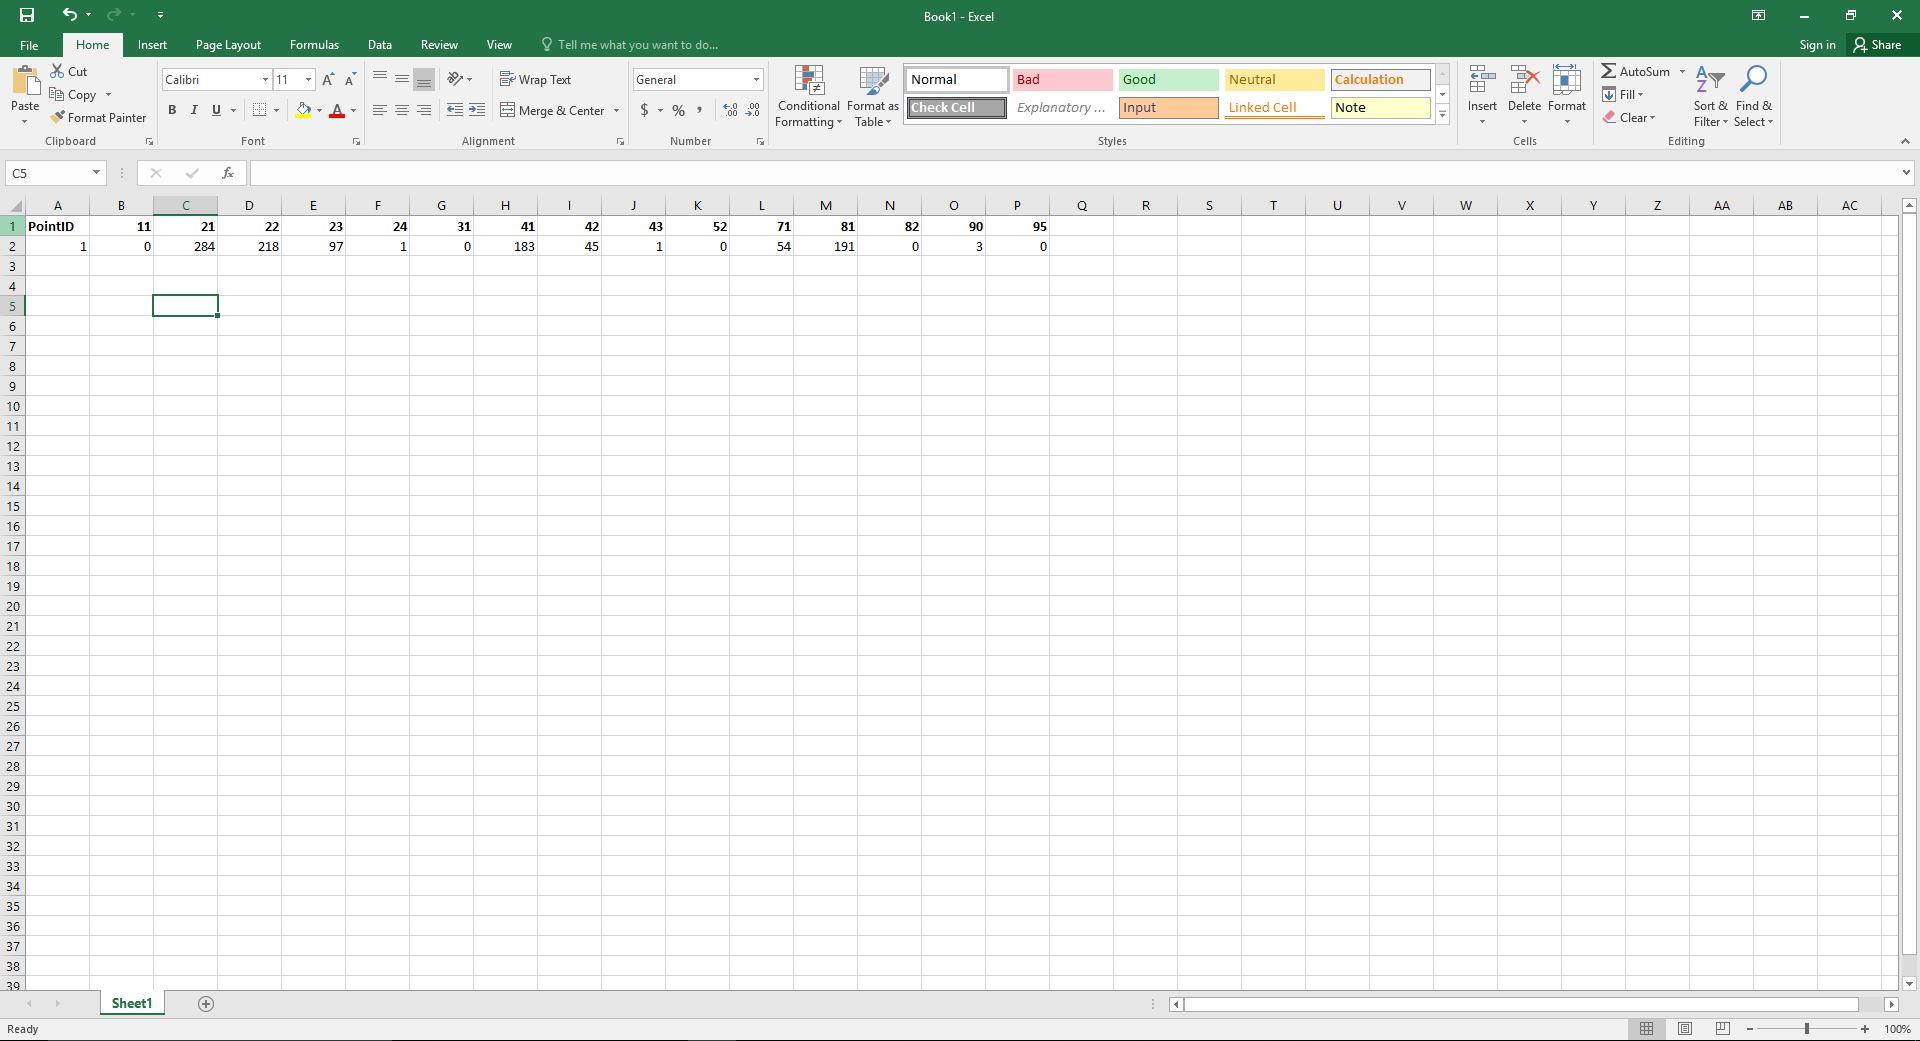
I am attempting to run a visibility analysis for 4,000+ points in ArcGis 10.4.1 model builder, and perform a zonal histogram on land cover types so that I quantify the number of cells visible of each land cover class from each point. I have gotten the model to work up to the zonal histogram stage successfully (it currently iterates through each point, makes a visibility raster for each point, then using the zonal histogram tool, calculates how many cells of each different land cover is visible using NLCD data). The goal now is to get the model to put the data into a usable form. For this, I need to convert the output table, which currently gives me a separate object ID for each combination of visible data and land cover types, to a single row with one object ID (the original reference point) and the land cover types visible from that point (as separate fields, populated with the number of cells visible). This way I can tell with point #1, 200 cells are visible forest and 250 cells are urban area, for example. Are there any suggestions for linking the data to one ID and shifting the NLCD classes into fields, instead of rows as they are currently? I then need to either append these to one data table, or back to the original point shapefile. My final goal is to have one shapefile or data table with all 4000 points, the NLCD classes, and the cells counts for each class. I have attached both current output of my model, and the desired output in an excel example file, as well as a view of the current model.
Thanks.
- Mark as New
- Bookmark
- Subscribe
- Mute
- Subscribe to RSS Feed
- Permalink
- Report Inappropriate Content
I'm not entirely sure if this will work for what you need, but how about employing a Pivot Table?
Pivot Table—Help | ArcGIS for Desktop
Note - it may also be easier to export the data to Excel and do a Pivot Table there (the Excel Pivot Table seems easier to use in some ways).
Chris Donohue, GISP
- Mark as New
- Bookmark
- Subscribe
- Mute
- Subscribe to RSS Feed
- Permalink
- Report Inappropriate Content
Thanks for the advice. The pivot table tool sounded promising, but it hasn't been working as I hoped. I could extract to excel and do it there, but I would need to independently extract 4000 zonal histogram tables that are made in arc and append them into one excel file. Do you know of any code sources to do that? I was hoping to pivot the tables in arc, assign a new ID to each file (because the OID is no longer linked to the original point in the zonal histogram table - so each row would have an ID that links with the original point shapefile) and then append them into one table so that I can join it back to the original point shapefile.