Turn on suggestions
Auto-suggest helps you quickly narrow down your search results by suggesting possible matches as you type.
Cancel
- Home
- :
- All Communities
- :
- Products
- :
- Data Management
- :
- Data Management Questions
- :
- Re: Drawing lines from points to *only* the neares...
Options
- Subscribe to RSS Feed
- Mark Topic as New
- Mark Topic as Read
- Float this Topic for Current User
- Bookmark
- Subscribe
- Mute
- Printer Friendly Page
Drawing lines from points to *only* the nearest points
Subscribe
3775
3
05-16-2013 06:07 PM
05-16-2013
06:07 PM
- Mark as New
- Bookmark
- Subscribe
- Mute
- Subscribe to RSS Feed
- Permalink
- Report Inappropriate Content
In ArcGIS 10 I have thousands of rail station points that are not connected to the road network, and I want them to be.
I know I can use snapping when I use Network Analyst, but for various reasons this not appropriate.
I have dabbled with near tables and spider diagrams but I can't seem to be able to get them to draw lines ONLY to the nearest points. It can be done of course by drawing full spiders and then matching and deleting, but that takes a great deal of manual work.
Googling has thus far not helped.
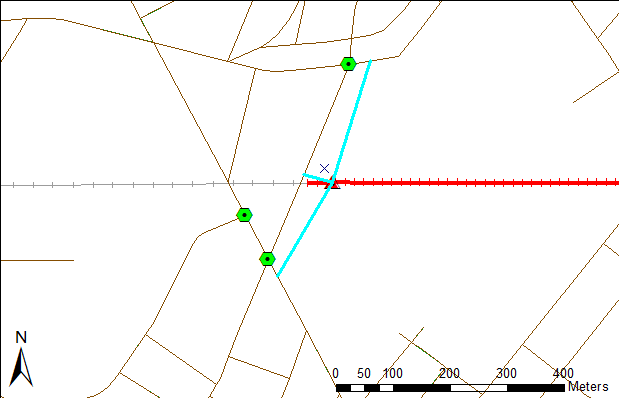
What I basically want is to automatically draw lines from the station points to the nearest three (or whatever, more than 1) points that I am designating.
Even better would be to draw lines to the nearest three lines on the road network.
[ATTACH=CONFIG]24402[/ATTACH] to [ATTACH=CONFIG]24403[/ATTACH] OR [ATTACH=CONFIG]24404[/ATTACH]
Is there any way (scripting/combination of tools) that this can be done? It seems like it should be simple but it is definitely not.
Thanks very much!
I know I can use snapping when I use Network Analyst, but for various reasons this not appropriate.
I have dabbled with near tables and spider diagrams but I can't seem to be able to get them to draw lines ONLY to the nearest points. It can be done of course by drawing full spiders and then matching and deleting, but that takes a great deal of manual work.
Googling has thus far not helped.
What I basically want is to automatically draw lines from the station points to the nearest three (or whatever, more than 1) points that I am designating.
Even better would be to draw lines to the nearest three lines on the road network.
[ATTACH=CONFIG]24402[/ATTACH] to [ATTACH=CONFIG]24403[/ATTACH] OR [ATTACH=CONFIG]24404[/ATTACH]
Is there any way (scripting/combination of tools) that this can be done? It seems like it should be simple but it is definitely not.
Thanks very much!
3 Replies
by
Anonymous User
Not applicable
05-22-2013
09:57 AM
- Mark as New
- Bookmark
- Subscribe
- Mute
- Subscribe to RSS Feed
- Permalink
- Report Inappropriate Content
Original User: pmcatnip
I dunno about connecting to the nearest streets but you can use Excel equations to automatically narrow down your spider diagrams/near tables to the nearest X number points. To do this each line should have a unique ID, length (or distance if a near table), and the ID of the origin rail. These should all already be there by default. Copy/paste your attribute table into Excel. Sort the data by two levels, first the origin rail ID then the length. In new columns to the right there are several options as to equations to find the nearest three (or whatever).
I'm thinking along the lines of assigning each row a value for the nearness ranking. The closest point would be 1, next point is 2, next point is 3 and so on. Here is an example. The equation in Column D checks if the origin ID is the same, then for each row associated with that origin gives it a rank according to the length. Then repeats for the next origin ID. The equation in Column E determines which rows to keep based on specifying however many you want.
[ATTACH=CONFIG]24582[/ATTACH]
Now back in GIS, you can do a table join to add the Keep field to your data using OID as the link. Select attributes with Keep = yes and export to a new layer. (EDIT: Actually the Keep field is unnecessary if you join the Near_Rank field instead and Select Attributes for Near_Rank =< 3. That may be more useful because you can change your mind at any time and export new layers with however many closest points you need.)
There is surely a way to script it in GIS using loops, or use IF statements in the field calculator, but in my opinion this is simpler.
05-23-2013
04:36 PM
- Mark as New
- Bookmark
- Subscribe
- Mute
- Subscribe to RSS Feed
- Permalink
- Report Inappropriate Content
Thanks very much!
This is actually quite simple and definitely doable with my current skill set.
This is actually quite simple and definitely doable with my current skill set.
by
Anonymous User
Not applicable
05-30-2013
02:39 PM
- Mark as New
- Bookmark
- Subscribe
- Mute
- Subscribe to RSS Feed
- Permalink
- Report Inappropriate Content
Original User: pmcatnip
Glad to help! If you don't mind, please click the check mark on the right side of the post to show that the question has been answered. 🙂
Glad to help! If you don't mind, please click the check mark on the right side of the post to show that the question has been answered. 🙂