- Home
- :
- All Communities
- :
- User Groups
- :
- Coronavirus disease 2019 (COVID-19)
- :
- Questions
- :
- Looking for and Arcade expression to calculate a r...
- Subscribe to RSS Feed
- Mark Topic as New
- Mark Topic as Read
- Float this Topic for Current User
- Bookmark
- Subscribe
- Mute
- Printer Friendly Page
Looking for and Arcade expression to calculate a running (moving) average of COVID-19 daily new cases
- Mark as New
- Bookmark
- Subscribe
- Mute
- Subscribe to RSS Feed
- Permalink
- Report Inappropriate Content
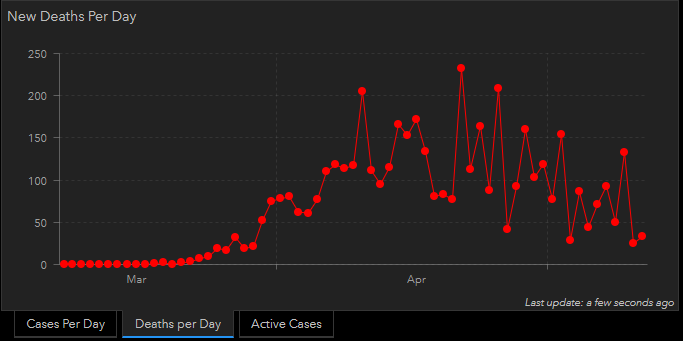
Many states or counties are reporting daily new COVID-19 cases and new COVID-19 deaths. This data charted either on a statewide or county level is often erratic. But a 3 or 5 or 7 day running (moving) average of the data plotted on top of the daily new cases or deaths does a better job of presenting the overall trend in the data. I am looking for a Python script or Arcade expression that I an use to quickly calculate a 3,5, or 7 day average of the data to use in ArcGIS Pro, AGOL, or a Dashboard. I am also looking for a way to keep the data up to date.
Thanks
- Mark as New
- Bookmark
- Subscribe
- Mute
- Subscribe to RSS Feed
- Permalink
- Report Inappropriate Content
Hi John Esch ,
I guess Python would be the right way to go in this case. For instance Pandas in Python has the rolling window you could apply (as described here: Moving Averages in pandas - DataCamp😞
df.rolling(window=size).mean()... and to keep the data up to date you could schedule the script using ArcGIS Pro: Schedule geoprocessing tools—ArcGIS Pro | Documentation .
- Mark as New
- Bookmark
- Subscribe
- Mute
- Subscribe to RSS Feed
- Permalink
- Report Inappropriate Content
Hi John-
Take a look at the Coronavirus Recovery Dashboard solution:
Coronavirus Recovery Dashboard | ArcGIS Solutions
Included is a pro package to help with the trend lines.
Jer