- Home
- :
- All Communities
- :
- User Groups
- :
- Coronavirus disease 2019 (COVID-19)
- :
- Questions
- :
- Re: Help with COVID-19 stats counters
- Subscribe to RSS Feed
- Mark Topic as New
- Mark Topic as Read
- Float this Topic for Current User
- Bookmark
- Subscribe
- Mute
- Printer Friendly Page
- Mark as New
- Bookmark
- Subscribe
- Mute
- Subscribe to RSS Feed
- Permalink
- Report Inappropriate Content
Hello,
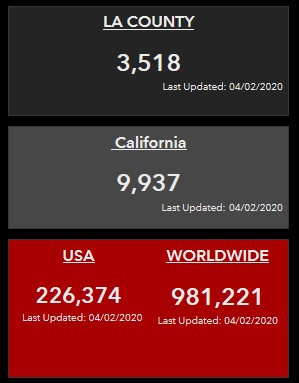
I am manually updating COVID stats in my AGOL Dashboard each day. I created them by using the Rich Text element. I am seeing that many dashboards out there have their stats automatically updating.
I have attempted to use the Embedded Content element but each time I use a URL it brings in the whole webpage. I am thinking that if I can get access to the specific URL for each counter perhaps the Embedded Content element can work.
Any tips or references to other posts about how I can automate this process will be greatly appreciated. Please note, I am fairly new at using Dashboards and I am strictly working off of AGOL. Also, I don't have access to an ArcGIS Server.
Here is an example of my current work.
Here is a link to the counter I would like to replicate its display of stats.
Thanks!
Solved! Go to Solution.
Accepted Solutions
- Mark as New
- Bookmark
- Subscribe
- Mute
- Subscribe to RSS Feed
- Permalink
- Report Inappropriate Content
Are you using a service from a authoritative source? John Hopkins University (JHU) shared their data to the public and can be easily added to your map in Portal/AGOL. I am using this link, just copy the service URL and add it to your map (https://services1.arcgis.com/0MSEUqKaxRlEPj5g/arcgis/rest/services/ncov_cases_US/FeatureServer ).
They are updating their data frequently, which eliminates any manual updating on your end. I created a Dashboard for my organization using their service and displaying the data using a List element or you can use an Indicator element. Hope this helps.
- Mark as New
- Bookmark
- Subscribe
- Mute
- Subscribe to RSS Feed
- Permalink
- Report Inappropriate Content
Hello Juan,
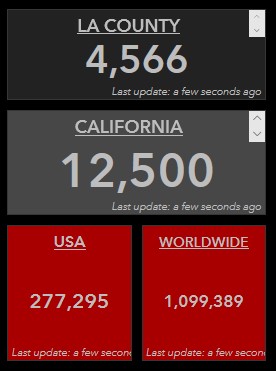
Thank you for the prompt response. I followed your guidance and I was able to make it work. I ended up opting for the Indicator element. Many thanks!!!
Here is an example of the outcome.
Just in case anyone sees this post in the future...if you don't know how to add a Feature Service/Service URL, they look like this,
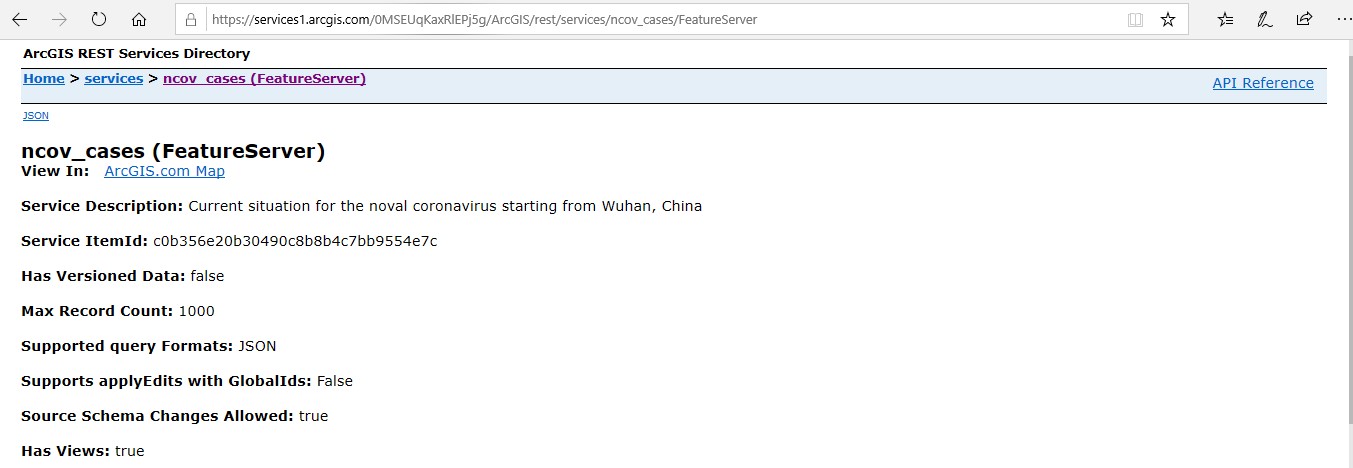
you can use this helpful guide: https://communityhub.esriuk.com/technicalsupport/2014/7/22/how-to-use-arcgis-server-services-in-arcg...
- Mark as New
- Bookmark
- Subscribe
- Mute
- Subscribe to RSS Feed
- Permalink
- Report Inappropriate Content
Glad you were able to make it work, that’s why we are here to help each other out.