- Home
- :
- All Communities
- :
- User Groups
- :
- Coordinate Reference Systems
- :
- Questions
- :
- Re: Help with transforming coordinate values
- Subscribe to RSS Feed
- Mark Topic as New
- Mark Topic as Read
- Float this Topic for Current User
- Bookmark
- Subscribe
- Mute
- Printer Friendly Page
Help with transforming coordinate values
- Mark as New
- Bookmark
- Subscribe
- Mute
- Subscribe to RSS Feed
- Permalink
- Report Inappropriate Content
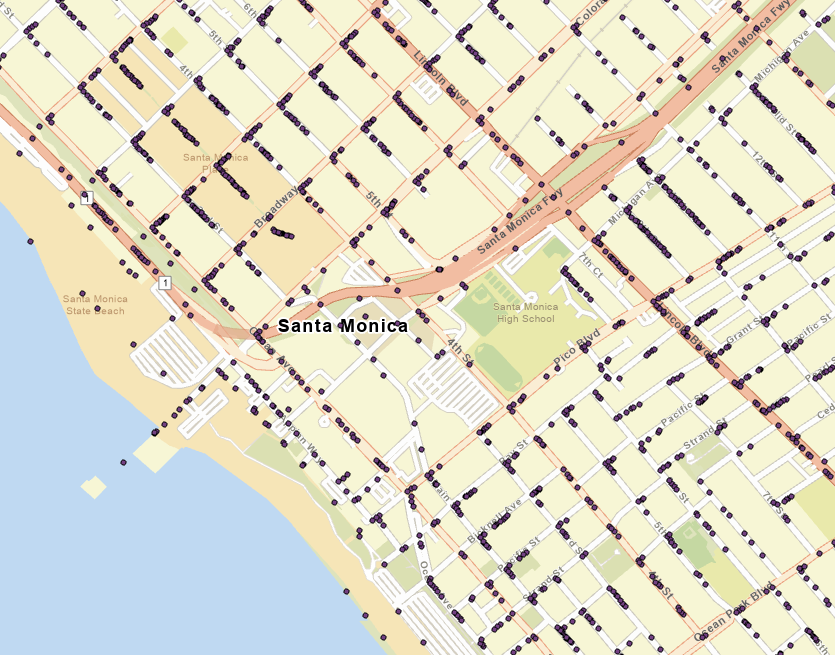
Hello, I am building a data pipeline that ingests a table of latitude/longitude coordinates and plots them on a map. All data points are located in Santa Monica, CA.
Here are some sample coordinates from the input table.
| lat | lon |
| 03401244 | 11829456 |
| 03400450 | 11829360 |
| 03400342 | 11829082 |
If I treat these values as decimal degrees, then the first row would be 34.01244, -118.29456. This plots the value far away from Santa Monica.
If I treat these values as degrees, minutes, seconds (DMS) data, then the first row would be 34° 01' 24.4", -118° 29' 45.6". Converting that value from DMS to DD gives me 34.02011, -118.496. This plots in Santa Monica BUT results in a strange clustered pattern on the map. Notice how all of the points are clustered in 'L' shapes near the intersections.
Does anyone have any idea what might be going on and how I can best convert the values into usable data? I have attached a zipped gdb of the input table for testing.
- Mark as New
- Bookmark
- Subscribe
- Mute
- Subscribe to RSS Feed
- Permalink
- Report Inappropriate Content
If these were collected by time, I would expect more while waiting at stop lights/signs and then turning. Less points mid-block when the vehicle was going faster.
Edit: If you label by ID or Sample ID, are the points progressing towards a corner, then turning?