- Home
- :
- All Communities
- :
- User Groups
- :
- Coordinate Reference Systems
- :
- Questions
- :
- Display XY data in Lambert
- Subscribe to RSS Feed
- Mark Topic as New
- Mark Topic as Read
- Float this Topic for Current User
- Bookmark
- Subscribe
- Mute
- Printer Friendly Page
- Mark as New
- Bookmark
- Subscribe
- Mute
- Subscribe to RSS Feed
- Permalink
- Report Inappropriate Content
Hello,
I am trying to display XY data in US Lambert Conformal Conic projection but all the points are plotted in a very small portion of Kansas when they should plotted across the US. All the points are Lin decimal degrees with two decimal places. Any suggestions?
Solved! Go to Solution.
Accepted Solutions
- Mark as New
- Bookmark
- Subscribe
- Mute
- Subscribe to RSS Feed
- Permalink
- Report Inappropriate Content
You must display the data in the coordinate system it was collected in. If the data is in decimal degrees then most likely it was collected in WGS84. After you properly display the data in its collected system you'll then want to leverage the Project tool to convert it into your needed system.
Project (Data Management)
http://desktop.arcgis.com/en/desktop/latest/tools/data-management-toolbox/project.htm
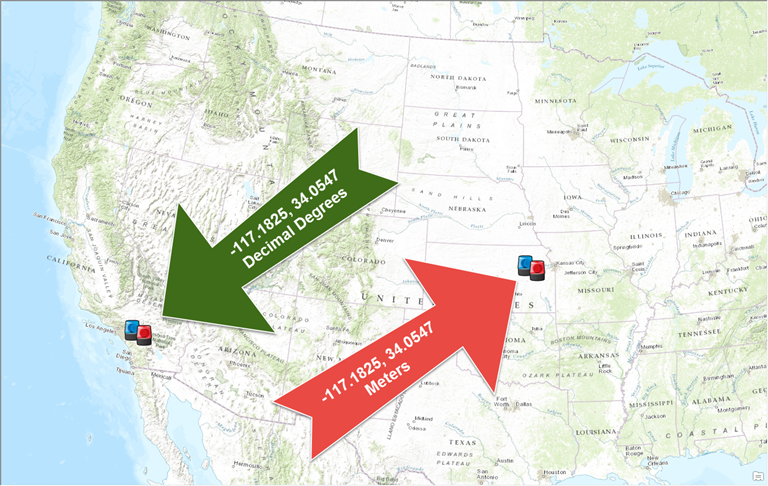
If you use Define against data that was collected in WGS1984 and use Lambert the coordinates will be treated as Meters instead of Decimal Degrees. For example, Redlands, CA is located at -117.1825, 34.0547 in WGS1984, which uses Decimal Degrees. If I were to define this as USA Contiguous Lambert Conformal Conic it would treat these coordinates as -117.1825 Meters and 34.0547 Meters, which would show up in Kansas, instead of the converted coordinates of -1934696.2044 Meters and -319966.3791 Meters.
- Mark as New
- Bookmark
- Subscribe
- Mute
- Subscribe to RSS Feed
- Permalink
- Report Inappropriate Content
How did you get the coordinates from decimal degrees to Lambert Conformal?
They are degrees, so they should have a spatial reference as such. If they havn't them you need to use Define projection.
But then do not simply redefine them as Lamb Conf. This does nothing to the underlying geometry, only fubars the meta data about the data.
You need to use the Project tool or change the dataframe properties to see them in a Lambert Conformal system.
- Mark as New
- Bookmark
- Subscribe
- Mute
- Subscribe to RSS Feed
- Permalink
- Report Inappropriate Content
Neil,
thanks for replying. When I display the XY data I hit the edit button and chose US Lambert Conformal Conic. The data was collected in decimal degrees. The only way I can get the points to display correctly is by choosing a geographic coordinate system, but I need it to be in Lambert.
- Mark as New
- Bookmark
- Subscribe
- Mute
- Subscribe to RSS Feed
- Permalink
- Report Inappropriate Content
You must display the data in the coordinate system it was collected in. If the data is in decimal degrees then most likely it was collected in WGS84. After you properly display the data in its collected system you'll then want to leverage the Project tool to convert it into your needed system.
Project (Data Management)
http://desktop.arcgis.com/en/desktop/latest/tools/data-management-toolbox/project.htm
If you use Define against data that was collected in WGS1984 and use Lambert the coordinates will be treated as Meters instead of Decimal Degrees. For example, Redlands, CA is located at -117.1825, 34.0547 in WGS1984, which uses Decimal Degrees. If I were to define this as USA Contiguous Lambert Conformal Conic it would treat these coordinates as -117.1825 Meters and 34.0547 Meters, which would show up in Kansas, instead of the converted coordinates of -1934696.2044 Meters and -319966.3791 Meters.
- Mark as New
- Bookmark
- Subscribe
- Mute
- Subscribe to RSS Feed
- Permalink
- Report Inappropriate Content
Freddie,
Thank you. Very helpful!!
- Mark as New
- Bookmark
- Subscribe
- Mute
- Subscribe to RSS Feed
- Permalink
- Report Inappropriate Content
Start a GIS session and add your table.
Use the Make Event Layer tool to add the XY data.
It should default to WGS84. it will then make an event layer.
After it is done the points should be in the proper spot.
Then export your Event layer to you database and it should automatically convert the projection.