- Home
- :
- All Communities
- :
- Industries
- :
- Commercial
- :
- Commercial Blog
- :
- Evaluating Fields Across a Table
Evaluating Fields Across a Table
- Subscribe to RSS Feed
- Mark as New
- Mark as Read
- Bookmark
- Subscribe
- Printer Friendly Page
- Report Inappropriate Content
I recently came across a scenario where I had to evaluate many fields across a table and, for each record, determine which field had the highest value. At first, I thought this would be easy. It’s just a field calculation with some if statements, right? The problem was that I had to evaluate over 50 fields. This means I had to explicitly account for every field I wanted to evaluate. My field expression was long, tedious to build, and completely unusable for any other data that I’d want to do this for. At the same time, I realized that being able to evaluate values across a table is a useful idea that is applicable to all sorts of data.
Sometimes in a collection of data there is a group of fields that represent a series. For example, for each branch or retail location, I might have annual revenue for each year in different fields (e.g. Rev2015, Rev2016, Rev2017, Rev2018, Rev2019 etc.). What if I want to simply evaluate, for each branch, which year had the highest (or lowest) revenue? Or what if I want to determine, for each branch, what the top three years for revenue are? Another scenario is a situation where I may have GeoEnriched many fields to a table. For example, I may have appended dozens of different consumer spending variables. What if I want to determine, for each trade area, which spending variable had the highest (or lowest) values? Or what if I want to rank the top three consumer spending values for each record?
Some of these questions can be answered through custom Field Calculator expressions, but it’s a process that quickly becomes very tedious if you’re evaluating more than a few fields, and the expressions you create will be very much linked to the data structure. For example, I can’t take the expression I built for comparing revenue years and use it for comparing consumer spending variables without carefully modifying the script. And if you’re needing to rank fields and write the results to multiple fields? Field Calculator, at least by itself, won’t help you there because it can only write to a single field at a time. The solution: python script tools!
Now don’t worry, I’m not going to walk you through the process of building a python toolbox, give you a few snippets, and wish you luck. What I’m here to do is share work that I’ve already done in building a flexible tool that tackles this challenge. In fact, you can download the tool today and test it out yourself…no coding, no configuration needed!
Once you’ve downloaded the toolbox, browse to it in ArcGIS Pro, expand the toolbox, and you’ll see two different tools at your disposal.
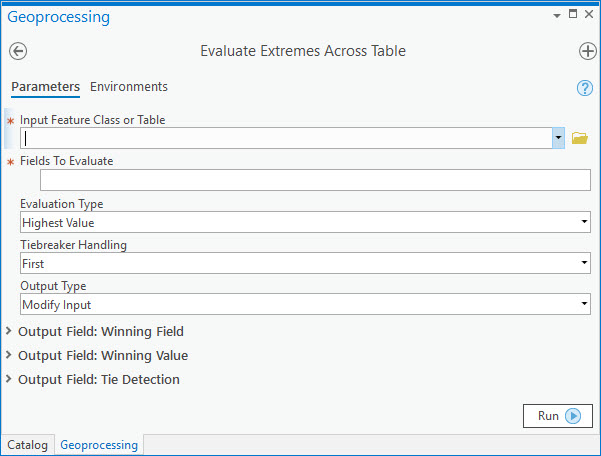
Evaluate Extremes Across Table - Evaluates each record in a table across a defined set of columns to find the highest or lowest values. These results are written to three new fields in either the input dataset or a new output file. The three new fields describe, for each row, the highest or lowest value in the evaluation, the name of the field that contained that value, and whether there was a tie between the winning field and another field. Here’s what the interface looks like:
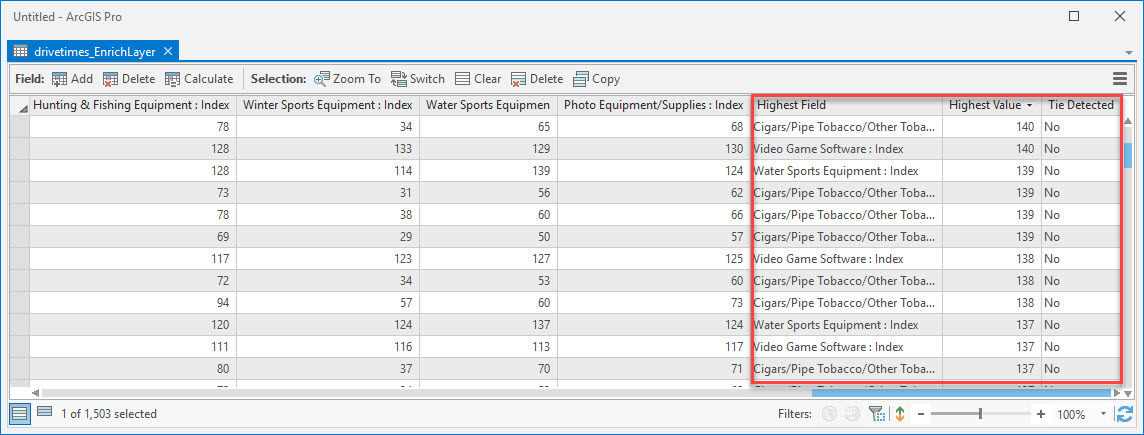
As an example, I geoenriched 15 consumer spending indexes to drivetime-based trade areas, and ran this tool to figure out which index was highest for each trade area.
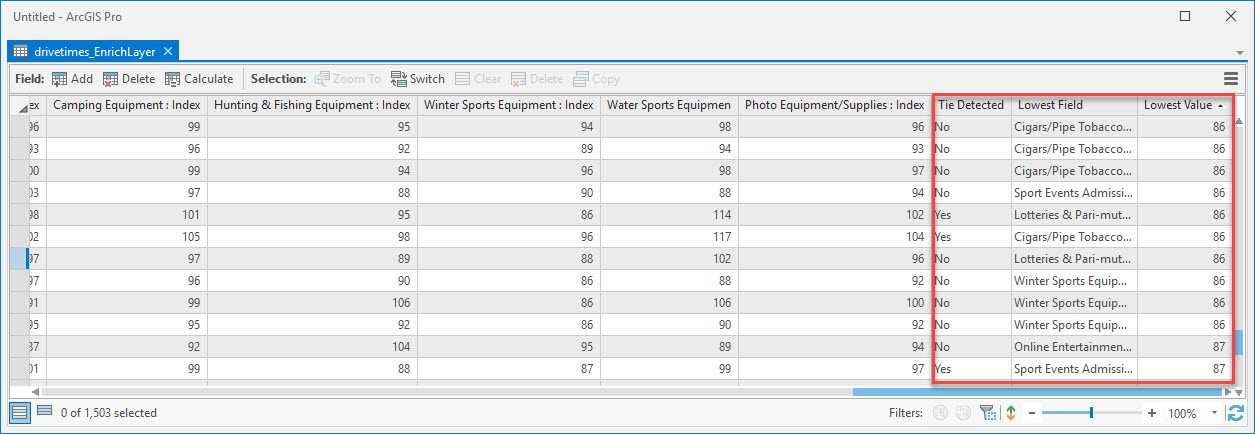
We can also reverse the analysis and identify which spending categories indexed the lowest for each trade area. Another useful feature highlighted here is Tie Detection. If two or more fields won out for the most extreme value, the tool lets you know through a field.
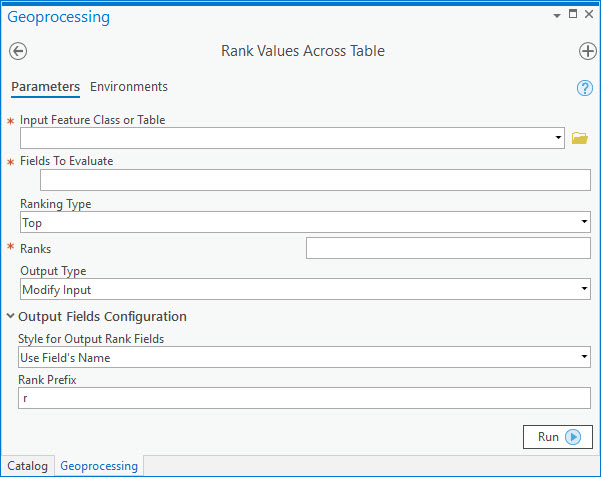
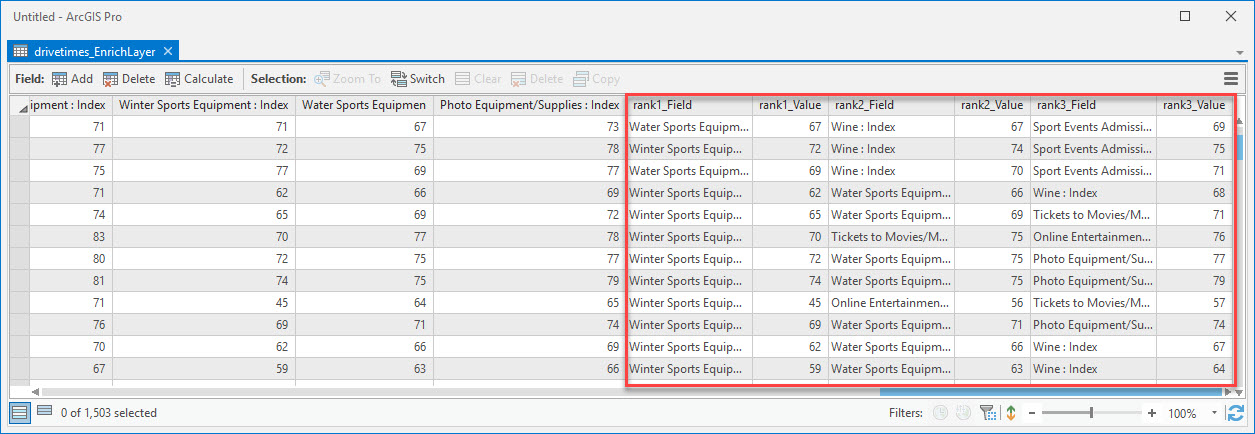
Rank Values Across Table - Evaluates each record in a table across a defined set of columns to rank the n top or bottom values. These results are written to a number of new fields in either the input dataset or a new output file. The number of new output fields is dependent on the number of ranks specified. Each rank will create two new fields. For example, if 3 ranks are desired, 6 new fields will be created. The two new fields per rank describe, for each row, the name of the field containing the ranked value, and the ranked value itself. Here’s what the interface looks like:
Working off the same example data we used in the first tool, we can use this Ranking tool to show us the top 3 spending categories that indexed highest for each trade area.

Conversely, we can also figure out the 3 bottom categories on the same set of data.
All of the documentation for each tool is in the Github repo itself, so I won’t get into it here. However, it’s worth reading through it before you start working with it. I’ve built a few niceties into the tool such as tie detection, alias handling, ranking controls, and support for evaluating multiple fields types at the same time. That’s right, you don’t have to do a bunch of field type conversions to make sure they all match up…that’s all handled by the tool as long as the fields are of a numeric type (short, long, float, or double).
Hopefully this will be useful for someone struggling with the same challenge I had. Keep in mind, it’s not perfect, and I guarantee that there are bugs in there. If you run into any of them, or have ideas on how to make the tool work better, please submit an issue on Github so I can continue to improve on it. Happy calculating!
You must be a registered user to add a comment. If you've already registered, sign in. Otherwise, register and sign in.