- Home
- :
- All Communities
- :
- Products
- :
- ArcGIS StoryMaps
- :
- Classic Esri Story Maps Questions
- :
- Re: How to add embedded chart from Flourish
- Subscribe to RSS Feed
- Mark Topic as New
- Mark Topic as Read
- Float this Topic for Current User
- Bookmark
- Subscribe
- Mute
- Printer Friendly Page
- Mark as New
- Bookmark
- Subscribe
- Mute
- Subscribe to RSS Feed
- Permalink
- Report Inappropriate Content
I want to embed a chart I made with Flourish into a story map I am making with Map Journal Builder. The iframe I get from Flourish looks like this:
<iframe src='https://public.flourish.studio/visualisation/506598/embed' frameborder='0' scrolling='no' style='width:100%;height:600px;'></iframe>
<div style='width:100%!;margin-top:4px!important;text-align:right!important;'><a class='flourish-credit' href='https://public.flourish.studio/visualisation/506598/?utm_source=embed&utm_campaign=visualisation/506598' target='_top' style='text-decoration:none!important'><img alt='Made with Flourish' src='https://public.flourish.studio/resources/made_with_flourish.svg' style='width:105px!important;height:16px!important;border:none!important;margin:0!important;'> </a></div>As you see, below the <iframe> there is a <div> to show the credit.
When I add it to the story map (Main stage/embed code) I get this message: Embed code can only contain one "<iframe>"
I could just add the chart link (https://public.flourish.studio/visualisation/506598/embed) in the web page link field instead but then the credit doesn't show and it's required.
I have tried to tweak the code like, for example, adding the <div> part into the <iframe> using a property called srcdoc to no avail.
Any idea how I can solve this problem?
Thanks!
Solved! Go to Solution.
Accepted Solutions
- Mark as New
- Bookmark
- Subscribe
- Mute
- Subscribe to RSS Feed
- Permalink
- Report Inappropriate Content
Hi Manuel -- Sorry you are having trouble getting a chart embedded in your story how you want. Since the main stage is an iframe, you're not able to put multiple elements in it.
My suggestion is that you put the chart in the side panel. You can use the HTML source editing mode to paste in the embed code for the chart <iframe> and credit <div>. You'll want to add some sizing parameters to the iframe to get the chart the size you want. In my example I used width="100%" and height="400px."
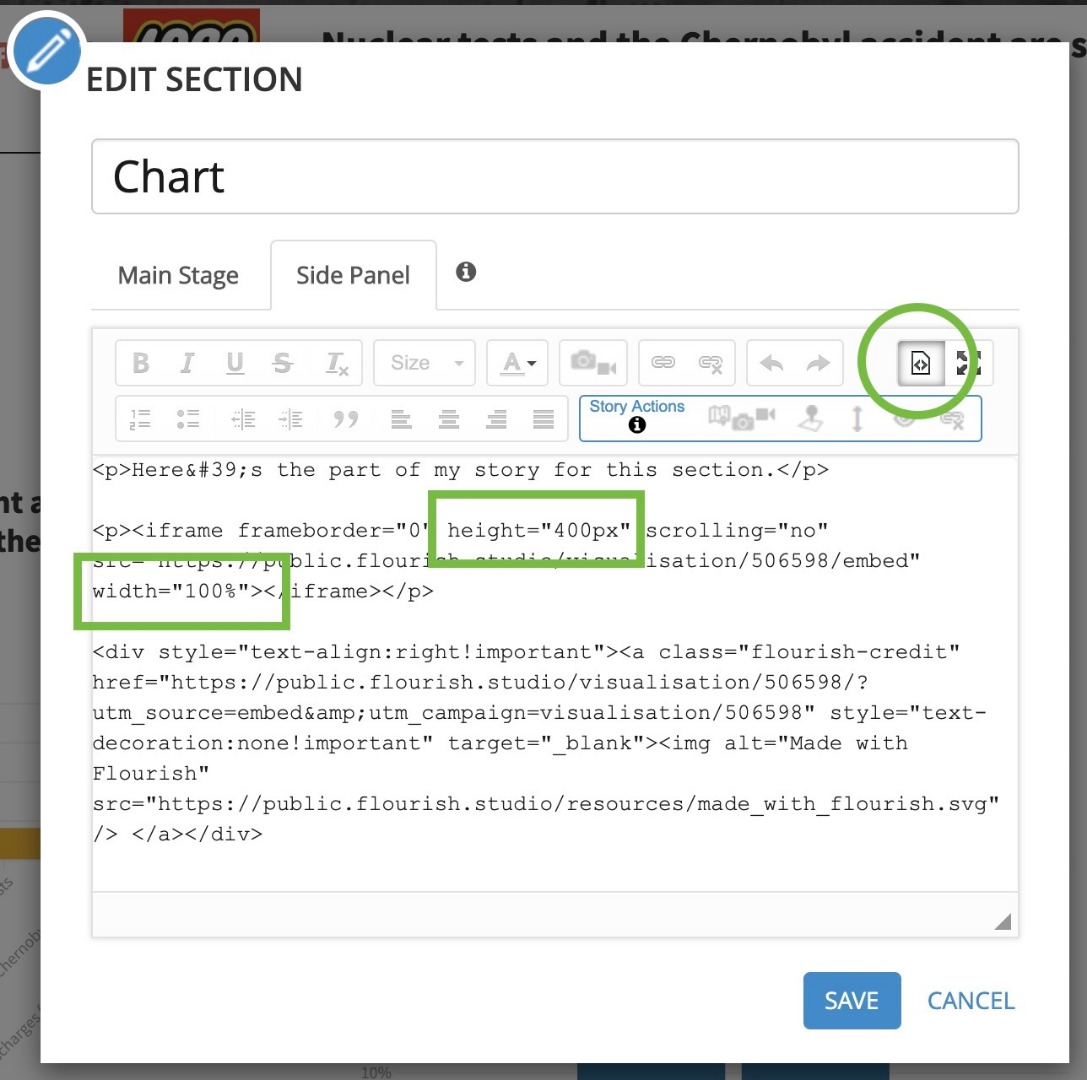
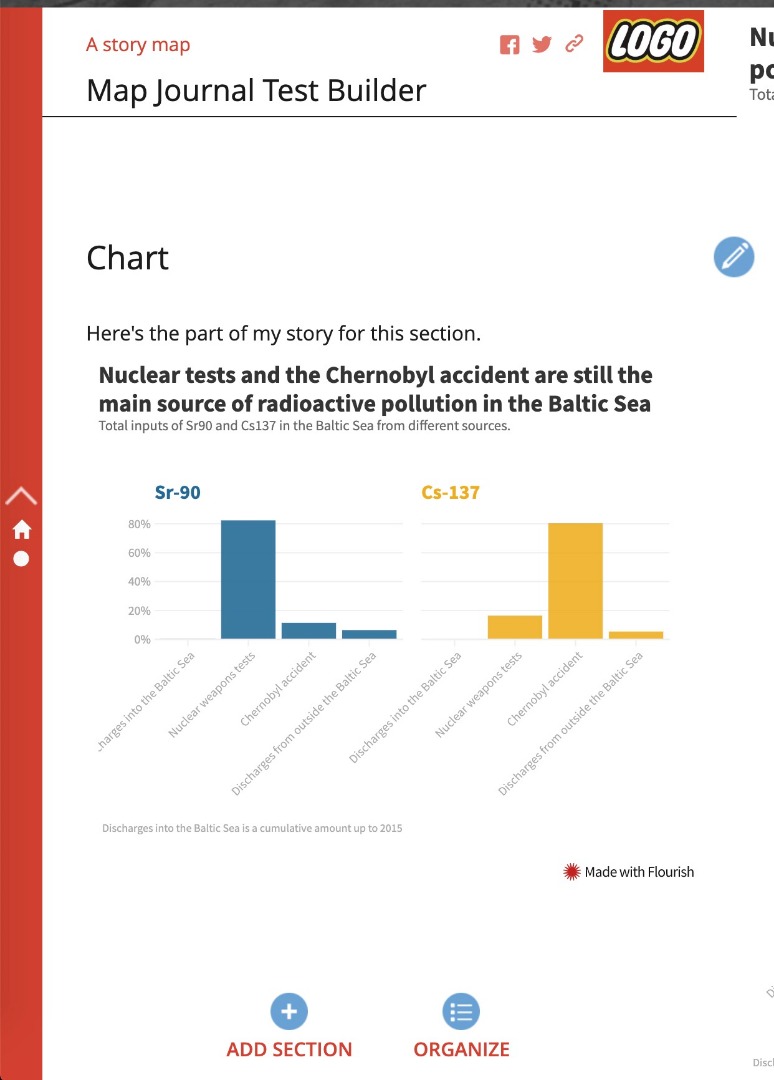
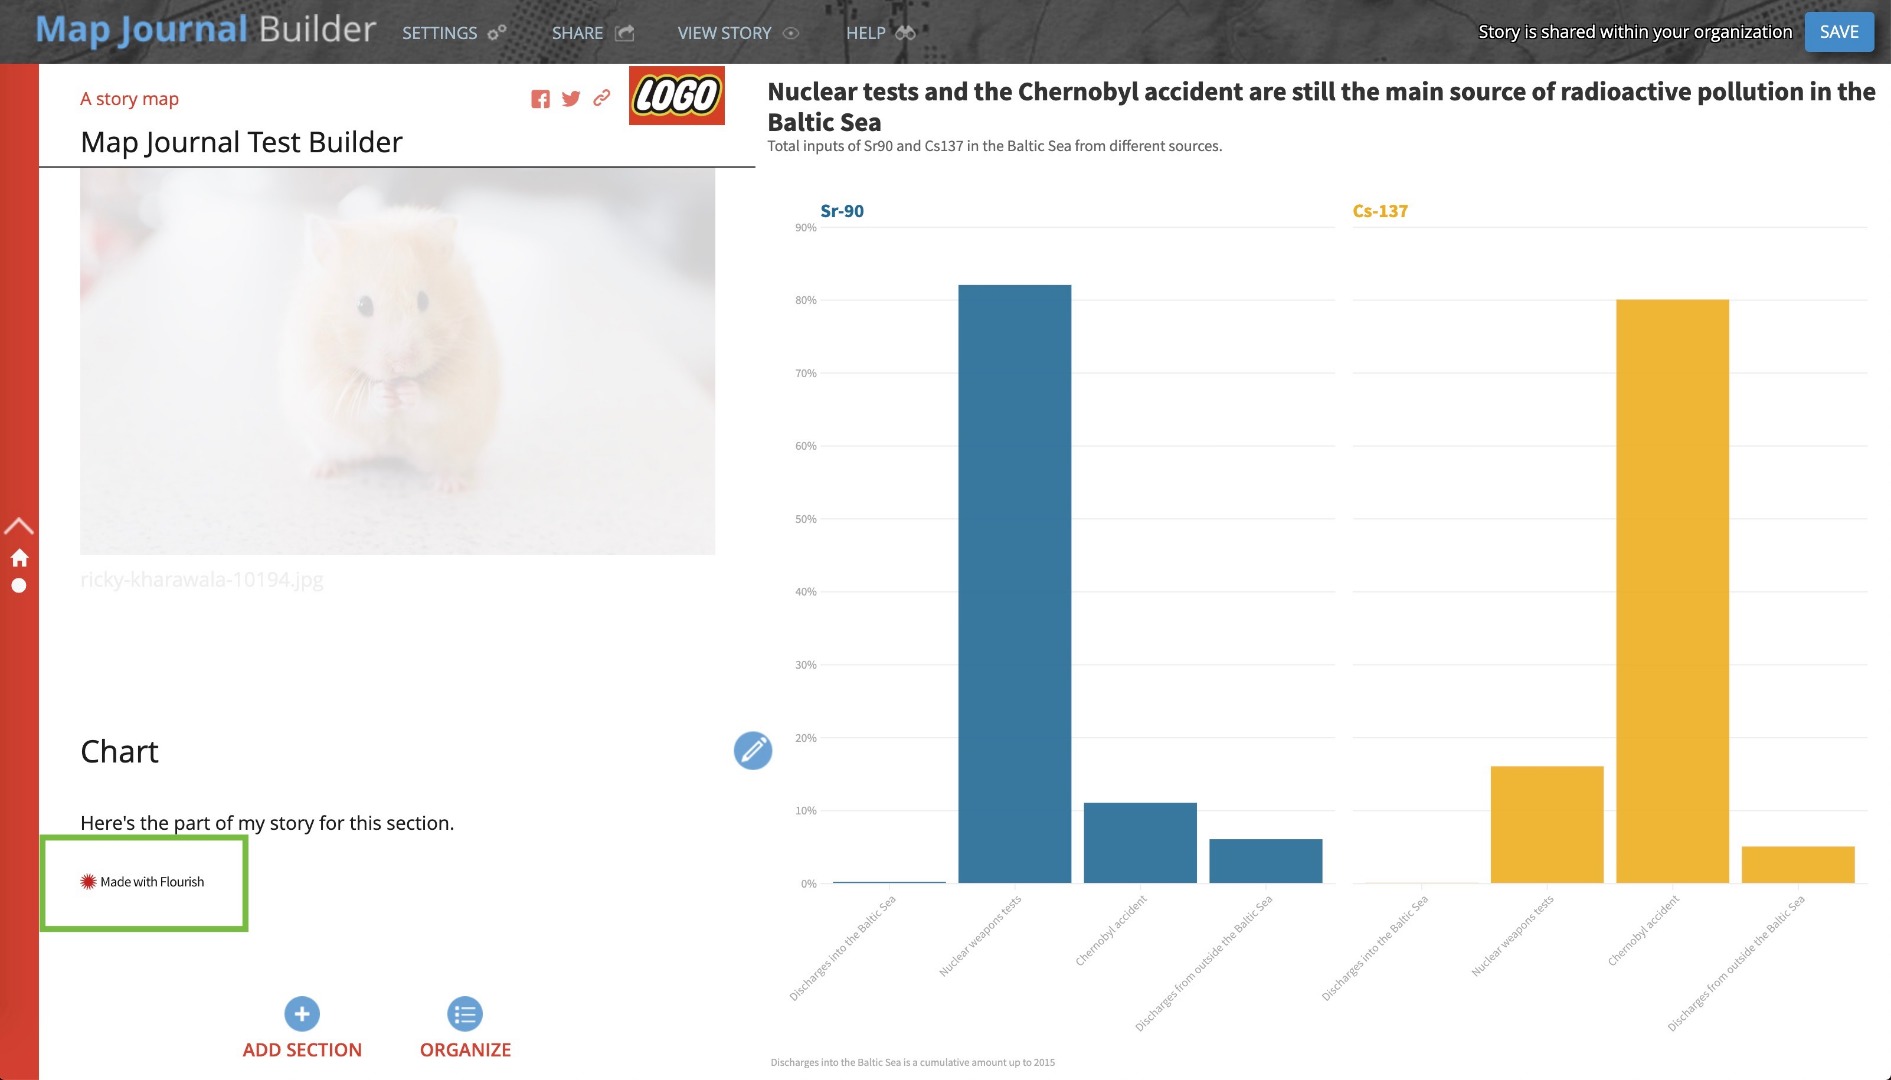
Another suggestion is to put the chart in the main stage and just the credit in the side panel (also using the HTML view). In my example, I also removed the right aligned formatting, but you can tweak the code and other text in the section to format/layout things as you see fit.
Hope this helps!
Owen
Lead Product Engineer | StoryMaps
- Mark as New
- Bookmark
- Subscribe
- Mute
- Subscribe to RSS Feed
- Permalink
- Report Inappropriate Content
Hi Manuel -- Sorry you are having trouble getting a chart embedded in your story how you want. Since the main stage is an iframe, you're not able to put multiple elements in it.
My suggestion is that you put the chart in the side panel. You can use the HTML source editing mode to paste in the embed code for the chart <iframe> and credit <div>. You'll want to add some sizing parameters to the iframe to get the chart the size you want. In my example I used width="100%" and height="400px."
Another suggestion is to put the chart in the main stage and just the credit in the side panel (also using the HTML view). In my example, I also removed the right aligned formatting, but you can tweak the code and other text in the section to format/layout things as you see fit.
Hope this helps!
Owen
Lead Product Engineer | StoryMaps
- Mark as New
- Bookmark
- Subscribe
- Mute
- Subscribe to RSS Feed
- Permalink
- Report Inappropriate Content
Thanks Owen for your excellent suggestions!
How could I make this work also in the cascade builder?
Manuel
- Mark as New
- Bookmark
- Subscribe
- Mute
- Subscribe to RSS Feed
- Permalink
- Report Inappropriate Content
Hi Manuel -- Unfortunately, there isn't an HTML view in Cascade, but you can add the credit as text (with a link, if desired) in the caption, if you're using the chart in an immersive section, you could add it in the narrative panel.
Lead Product Engineer | StoryMaps