- Home
- :
- All Communities
- :
- User Groups
- :
- Archaeology GIS
- :
- Questions
- :
- Creating a shovel test grid for Cultural Resource ...
- Subscribe to RSS Feed
- Mark Topic as New
- Mark Topic as Read
- Float this Topic for Current User
- Bookmark
- Subscribe
- Mute
- Printer Friendly Page
Creating a shovel test grid for Cultural Resource Management
- Mark as New
- Bookmark
- Subscribe
- Mute
- Subscribe to RSS Feed
- Permalink
- Report Inappropriate Content
I can't find a good amount of information on creating a grid within a set boundary and using the intersection points as points for data. I work in the archaeology field and we dig shovel tests on a 50 foot grid. I am trying to figure out a way of creating a grid before entering the field, where each intersection point already has a distinct GPS point, and data can be entered via a database app in reference to each one of these points. Can anyone help me through this process?
I understand the fishnet tool, but not sure how to use the intersections and create points for each, and additional attributes to be filled in later. And how could I label each point based off of that grid system of x, y? For example, transect 1, shovel test 1.
- Mark as New
- Bookmark
- Subscribe
- Mute
- Subscribe to RSS Feed
- Permalink
- Report Inappropriate Content
I am not an archeologist, help me out here, when you say 50' grid I am assuming that's a polygon and you subdivide it into small squares? Or that's the size of one square in a big grid?
When you say you have GPS points, what do they look like? That is, GPS data wanders around, do you mean you have decimeter or better accuracy for a grid of points?
Writing a bit of code to generate a grid is the easy part for me. 🙂 Knowing what you want is the hard part.
If you have a picture or reference to a web site that would teach me more please post it and I will help you.
- Mark as New
- Bookmark
- Subscribe
- Mute
- Subscribe to RSS Feed
- Permalink
- Report Inappropriate Content
https://drive.google.com/open?id=0B9EAL0oxgEMwXzdFN3h4c1I0azA
I attached a link to a sketch of what I'm looking to do. Project areas are often not perfect rectangular grids so sometimes the grid is somewhat amorphous. An X axis is the Transect # (1,2,3,4...) and the Y axis is Shovel Test # (1,2,3,4...). From one 1,2 to 1,1, the distance is 50 feet, so yes, one block is 50' square.
So at each intersection, we are digging a shovel test pit and recording information. Mainly measurements, soil type, and artifact presence, if any. I want to have a GPS coordinate using WGS84 for each point so field surveyors can walk straight to that point without having to manually sight with compasses. So the GPS is generated in ArcMap before even heading out into the field.
I hope that is a little bit clearer.
Thanks Brian.
- Mark as New
- Bookmark
- Subscribe
- Mute
- Subscribe to RSS Feed
- Permalink
- Report Inappropriate Content
Eric,
A friend told me building bicycle wheels was like knitting for him. For me it's coding. Sometimes I write code because it's fun and satisfying and so the "Thought before tools and tools way before coding" does not always apply for me. Also sometimes having EXACTLY the write tool is so satisfying that I just have to build my own.
I will look at your picture and notes again after lunch!
Brian
- Mark as New
- Bookmark
- Subscribe
- Mute
- Subscribe to RSS Feed
- Permalink
- Report Inappropriate Content
Further thoughts
Would this work as a suggested work flow?
Working in a map with local coordinate system in FEET,
1 Create a line to define the origin (1,1) and direction of the Y-axis.
2 Select a template polygon feature class to define extent.
3 Run tool to generate grid.
4 If you need to tweak the grid, do that now using ArcGIS edit tools.
5 Run tool to convert grid to points; the tool will also label
points (X,Y) starting at (1,1) by default.
6 If you need to tweak any POINTS you can do that now; move, add or delete
points and edit the labels in attribute data. The labels will be exported
to the GPX file so you can see them on the GPS screen.
7 Use tool to reproject to WGS84 and export to GPX file for field use.
(When I say "tool" here I mean some operation that might be a piece
of python or a model or a generic ESRI tool
for the purposes of discussion assume it exists.)
In step 1 I assume you draw a line starting at point (1,1) and going
up in the direction of "Y"
and that direction is not "North" Then the tool in step 3 works
"up" and to the right generating 50' squares
until it hits the edge of the template. It will generate complete
squares only, corners OUTSIDE the template
will not generate points.
My assumptions so far:
The template polygon feature class will have just one polygon in it
Each intersection is the location of shovel test. Using centroids is
a great way to use Fishnet but will create confusion when visualizing
the fishnet grid. The grid-to-point tool (step 5) will deal with corners.
Your GPS unit can accept a GPX file. Does it?
- Mark as New
- Bookmark
- Subscribe
- Mute
- Subscribe to RSS Feed
- Permalink
- Report Inappropriate Content
You could either use the centroids of the fishnet to serve as your reference points... or convert the fishnet to points which will have a point at each intersection... you will then have to clean up the point file to remove duplicates.
All are doable, but I will spare you the tool links for now.
Once the geometry is created, then you will have to add fields to the table and calculate the long/lat values (easy) to tie them into your points. Add further text or numeric fields getting them in the order you want... don't skip the thought/workflow process when doing this or you will be jumping around the table.
Write it out on paper... why does it have to be an intersection of two lines? why not the centroid of a square?
Thought before tools and tools way before coding
- Mark as New
- Bookmark
- Subscribe
- Mute
- Subscribe to RSS Feed
- Permalink
- Report Inappropriate Content
I guess it could be a centroid. You're right. It achieves the same distance between points. It's just how I've always hand drawn it. What duplicates would there be though?
- Mark as New
- Bookmark
- Subscribe
- Mute
- Subscribe to RSS Feed
- Permalink
- Report Inappropriate Content
Picture an intersection point of 4 square polygons... the intersection point will be contained in each polygon, hence, if you convert the polygon to points, you will have at least 4 identical points (even more if the intersection point is the start/end point of a polygon)
In short... centroids are best... just shift in your mind your lines so that they are offset by 1/2 half the distance between the points... hope you catch my drift
- Mark as New
- Bookmark
- Subscribe
- Mute
- Subscribe to RSS Feed
- Permalink
- Report Inappropriate Content
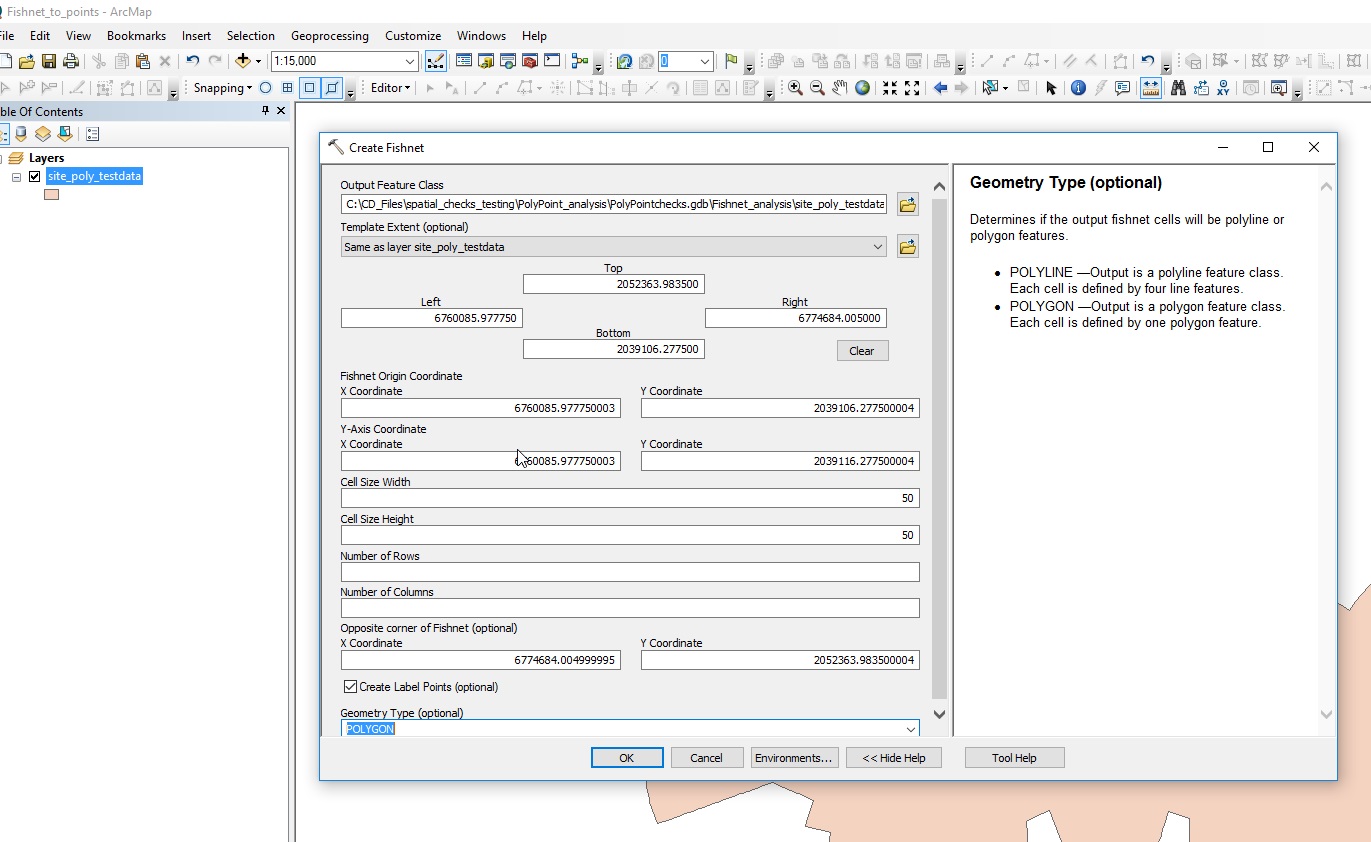
As suggested by others, this can be done with the Create Fishnet (Data Management) tool
Create Fishnet—Data Management toolbox | ArcGIS Desktop
Note that checking off the 'Create Label Points (optional) checkbox in the tool will provide a points layer of the centroids. After that, it is just a question of culling down the points to just within your site and then adding whatever fields are needed.
Chris Donohue, GISP
- Mark as New
- Bookmark
- Subscribe
- Mute
- Subscribe to RSS Feed
- Permalink
- Report Inappropriate Content
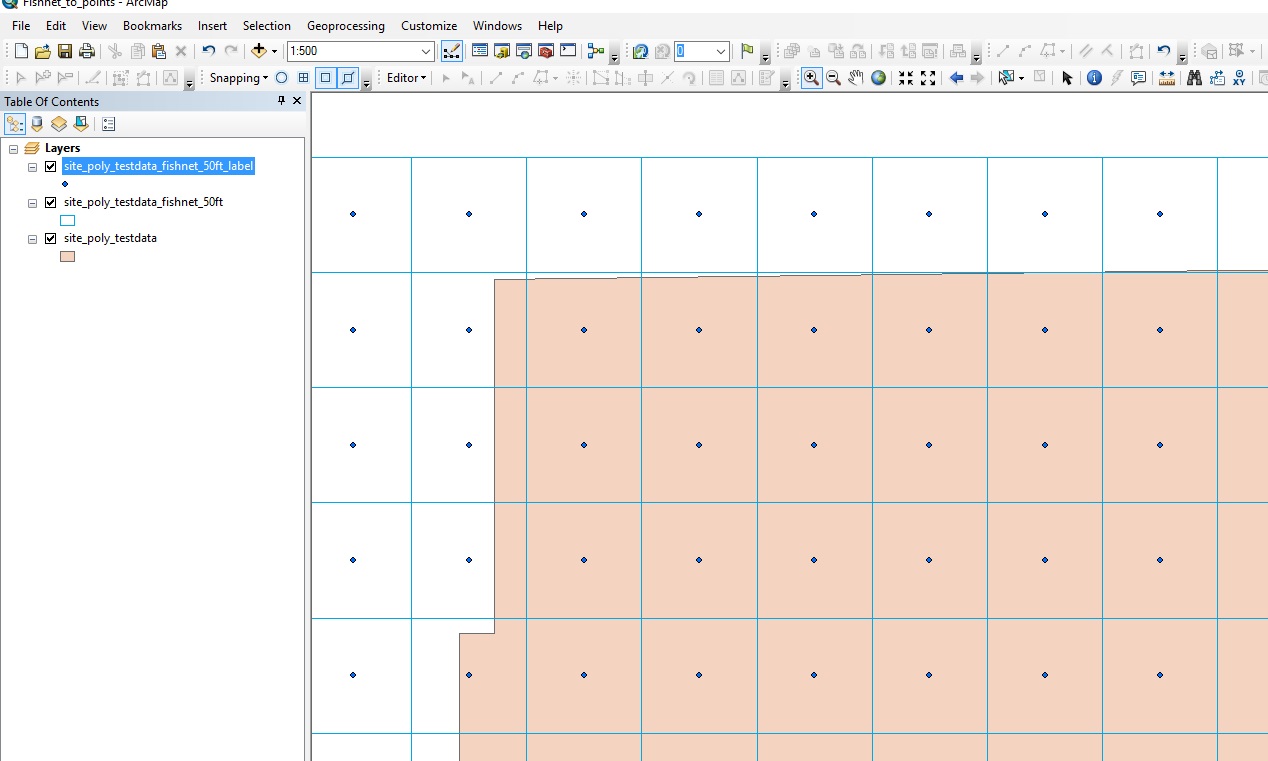
I now have my "shovel test" tool generating a grid of polygons and points, it measures the extent of the template polygon to figure out the grid size and then clips points generated to be to the right and above the origin and inside the template.
Each point feature contains a "label" field that has the grid numbers as shown.

If you wanted tiles to start lower down you'd need to drag the baseline south and run the tool again.
Those are 50' tiles.
I can publish the code if you want it. I did this as an exercise. Drop me a line or reply here.