- Home
- :
- All Communities
- :
- Products
- :
- ArcGIS Web AppBuilder
- :
- ArcGIS Web AppBuilder Questions
- :
- Re: Ideas on how to develop a natural hazard map w...
- Subscribe to RSS Feed
- Mark Topic as New
- Mark Topic as Read
- Float this Topic for Current User
- Bookmark
- Subscribe
- Mute
- Printer Friendly Page
Ideas on how to develop a natural hazard map with report tool in AGOL?
- Mark as New
- Bookmark
- Subscribe
- Mute
- Subscribe to RSS Feed
- Permalink
- Report Inappropriate Content
I am trying to develop a basic web app that shows a map with some natural hazards layers and generates a report for the user. Ideally, the app would allow the user to do the following steps:
1. Search and zoom to their address
2. Calculate the distances to the closest hazards to their property (within user defined buffer)
3. Display the distances to those hazards on the map
4. Output the map and results into a basic report
I've tried using the Situation Awareness widget in WebApp builder which can successfully complete steps 1, 2 and 4 (have to do print of map and report separately). However, the results bar that is generated from the widget does not display the distances to the hazard layers. It only displays the configured attributes from the pop-up window.
I've also tried using the Incident Analysis widget in WebApp building. It can complete steps 1-3. I can use the Print widget to print the map, but the Incident Analysis widget does not have the report functionality to export the results.
Lastly, I've tried using ESRI's My Hazard Information app from the Emergency Management solution. It has a custom hazard app which seems to be similar to the Near Me widget in WebApp builder. It also can complete steps 1-3 but also does not have a report functionality. Again, I can use the Print widget to print the map, but it does not have a report functionality to report out the distance results with the map.
Does anybody have any other ideas on how I can display the distance results on the map as well as export into a report using an AGOL product? Ideally the report would include a screen shot of the map and the hazard attributes including the distance.
- Mark as New
- Bookmark
- Subscribe
- Mute
- Subscribe to RSS Feed
- Permalink
- Report Inappropriate Content
Molly,
I am curious to know if you found a solution to this?
I would suggest tagging Natural Resources, Web AppBuilder Custom Widgets, State and Local - Environment and Natural Resources
- Mark as New
- Bookmark
- Subscribe
- Mute
- Subscribe to RSS Feed
- Permalink
- Report Inappropriate Content
Hi Adrian,
I haven't found a solution for this yet Thanks for the tips on updating the tags.
- Mark as New
- Bookmark
- Subscribe
- Mute
- Subscribe to RSS Feed
- Permalink
- Report Inappropriate Content
Hi Molly,
Would it be possible for you to provide me a sketch of how the map and report would look like?
also, are your services hosted on arcgis online or within an enterprise server. are they public that I can take a look at?
lastly, pls take a look at the following blog post and see whether this might help you with reporting or not.
Thanks.
Tanu
- Mark as New
- Bookmark
- Subscribe
- Mute
- Subscribe to RSS Feed
- Permalink
- Report Inappropriate Content
Hi Tanu,
Thanks for reaching out. The first attachment is a report that was created using ArcGIS Pro. These reports were created for some public meetings so the homeowners could take them home. We are hoping to transition to using an online map/app so it is more interactive and has more functionality for the user. However, we recognize that some users still like to have printed maps/reports so we don't want to lose that functionality. 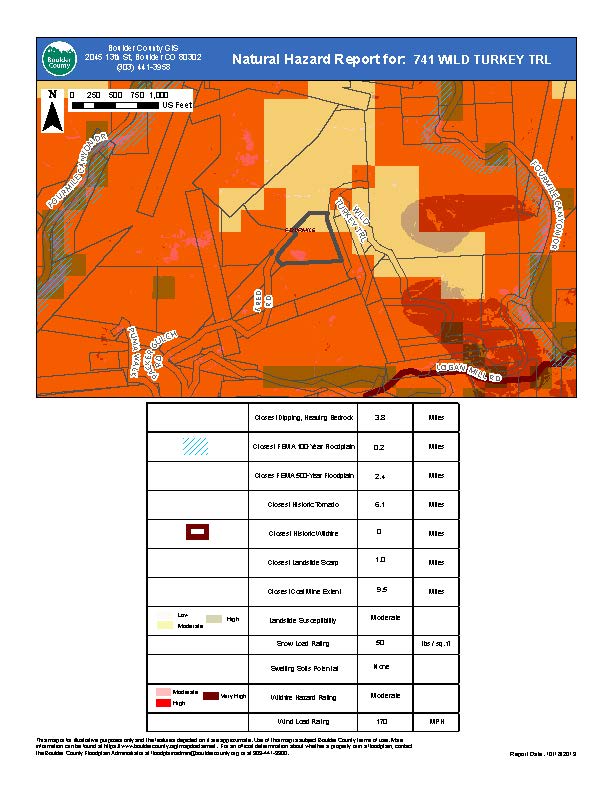
The second attachment includes a screenshot of me putting together different functions of the webapp builder map I created into one report. I experimented with using the Situation Awareness widget and the Incident Analysis widget. Ideally it could be printed to show the map, the legend and the hazard layers with their associated distances from the subject property. Right now, the legend goes away when you click on the bottom hazards bar so a user can't do a screenshot or print screen and get all the information at the same time.

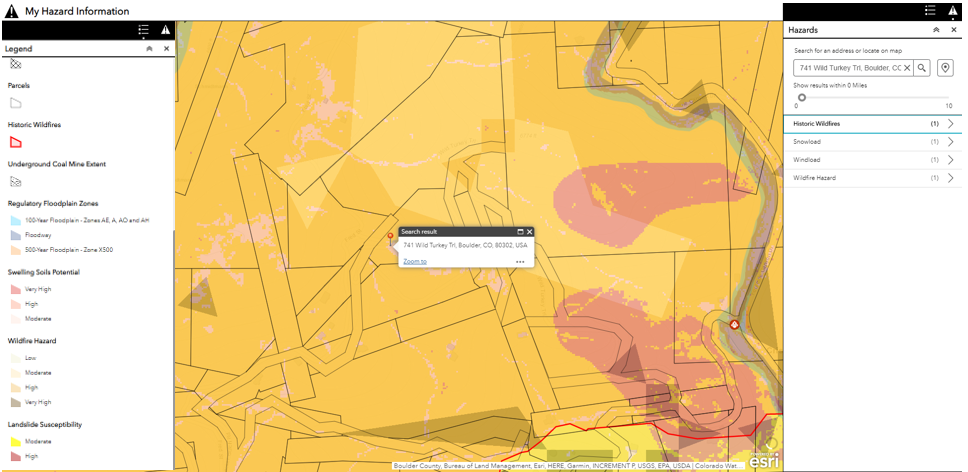
The third attachment includes a screenshot of the My Hazard app built by ESRI that I customized. Similar to above, I put together the map and legend into one screen shot so it could be printed. It would be nice if the panel on the right showed the distances (in addition to the number of layers in parenthesis or instead of). The user can click on each layer to see the distances which works great for online, but the distances aren't displayed for printing. Also, the legend goes away when you click on the hazards widget so you can't do a screenshot or print screen of all the information.
Some of our services are hosted through our Boulder County organization account and some are hosted through my personal account. Here are some of the URLs I used in my map:
http://maps.bouldercounty.org/arcgis/rest/services/HAZARD/FIRE_WILDFIRE_HISTORY/MapServer
http://maps.bouldercounty.org/arcgis/rest/services/HAZARD/FLOODPLAIN_REG_COMPOSITE/MapServer
http://maps.bouldercounty.org/arcgis/rest/services/HAZARD/HAZARD_STEEPLY_DIPPING_BEDROCK/MapServer
http://maps.bouldercounty.org/arcgis/rest/services/HAZARD/HAZARD_SWELLING_SOILS_BEDROCK/MapServer
http://maps.bouldercounty.org/arcgis/rest/services/Hazards/WildfireHazardRating/MapServer
http://maps.bouldercounty.org/arcgis/rest/services/PLANNING/BCBC_Snowload_2017/MapServer
http://maps.bouldercounty.org/arcgis/rest/services/PLANNING/BCBC_Windload_2017/MapServer
I am happy to create a group and share my map or apps with you if that is easier to view them.
Lastly, I don't see a link to the blog post you referenced. Can you resend that?
Thanks,
Molly
- Mark as New
- Bookmark
- Subscribe
- Mute
- Subscribe to RSS Feed
- Permalink
- Report Inappropriate Content
Hi Molly Watson,
Sorry for the delay and thank you for providing valuable information. I will take a look.
Lastly, I don't see a link to the blog post you referenced. Can you resend that?
duh, forgot to copy/paste the url. here you go
Print reports from ArcGIS Enterprise web apps
I will get back to you soon.