- Home
- :
- All Communities
- :
- Products
- :
- ArcGIS Survey123
- :
- ArcGIS Survey123 Blog
- :
- Survey123 Tricks of the Trade: XLSForms and locati...
Survey123 Tricks of the Trade: XLSForms and location quality
- Subscribe to RSS Feed
- Mark as New
- Mark as Read
- Bookmark
- Subscribe
- Printer Friendly Page
- Report Inappropriate Content
In this blog post, I describe some common techniques that will help you better understand and hopefully improve the quality of location data you get from field users. Location data quality depends on multiple factors, including field conditions, field user skills and the hardware used. Having said this, a good smart form design can do a lot to help get the best possible quality location data.
This post focuses particularly on field data collection workflows where you will rely on integrated or external GNSS receivers to capture location data. It assumes familiarity with XLSForms, Survey123 Connect and the Survey123 field app.
Persisting Location Accuracy (Part 1)
If location quality matters to you, you should consider systematically storing the location accuracy of every record captured. This is just as true for formal high accuracy field data collection workflows by professionals, as it is for casual field data collection by volunteers. Horizontal accuracy is about the simplest and most important quality indicator of your location data. Having field users understand the horizontal accuracy while they collect data is not enough; you need to persist it for every record captured, so you can analyze it later.
In XLSForm, you can store the horizontal accuracy as reported by your field device as follows:
| type | name | label | calculation | bind::esri:fieldType |
| geopoint | location | GPS Location | ||
| calculate | accuracy | HA | pulldata("@geopoint",${location},"horizontalAccuracy") | esriFieldTypeDouble |
The key is the calculation in the second question of the survey. It automatically gets the horizontal accuracy from the geopoint question and stores it in a field named accuracy. Since you do not want end users to overwrite this value, the sample above keeps the output of the calculation in a question of type calculate. Calculate questions are not presented to the end-user in the form, but their values can be be stored in ArcGIS. In this particular case, since the horizontal accuracy is expressed in meters, the bind::esri:fieldType column has been set to esriFieldTypeDouble. If the esri:fieldType value is not set explicitly, Survey123 will automatically store the calculated value as text.
Horizontal accuracy values are always expressed in meters.
I like to add a calculate like the above to every survey I prepare for field data collection. Looking at a dataset from field users without location accuracy information is not very comforting. Without location accuracy information in a GIS dataset, what level of confidence can you have on those points in the map? Capturing the horizontal accuracy like described here adds absolutely no overhead, and it always pays off.
In the next screenshot, locations captured along a trail have been buffered to visually represent the reported horizontal accuracy. This simple visualization can provide you with great information about the quality of locations in your dataset. Before performing GIS analysis, you can set criteria to filter out records that do not meet a location accuracy threshold of your choice.
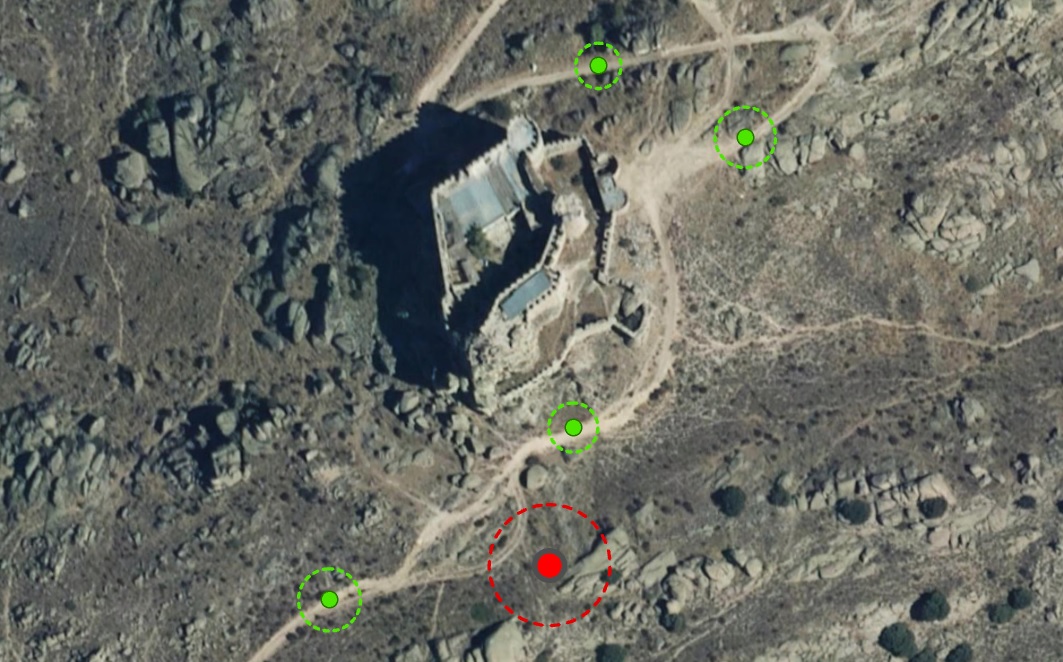
You can also use the location accuracy information to better understand in what conditions poor location data is created. You can analyze spatial patterns, identify particular users or devices that do not meet minimum standards.
Persisting Location Accuracy (Part 2)
The horizontal accuracy that Survey123 returns from a geopoint value is provided by the location sensor you are using. On top of the actual value (say 6.2 meters for example), it is important to understand the level of confidence level for that value. That is, with what level of confidence will the location be within a radius of the horizontal accuracy reported (say within a radius of 6.2 meters of the point for example)?
The Google Developer documentation, defines horizontal accuracy as the radius of 68% confidence. This is like saying that for Android devices, there is a 68% chance that the true location is within a radius equal to the reported horizontal accuracy. Apple has not documented their definition of horizontal accuracy.
When using external high accuracy GNSS receivers with Survey123, the confidence interval can be more accurately be defined if the receiver is able to report what is known as root mean square (RMS) accuracy. For RMS accuracy, the default CL (Confidence Level) is 68%. Some organizations require reporting accuracy with a 95% CL. If this is the case, the United States Federal Geographic Data Committee (FGDC), through its National Standard for Spatial Data Accuracy, establishes that the following factors should be applied:
- 1.7308 for horizontal accuracy.
- 1.9600 for vertical accuracy.
The conversion between RMS 68% CL and 95% CL applying the factors above should only be calculated, again, if the GNSS receiver is reporting horizontal accuracy using RMS. In the https://community.esri.com/groups/survey123/blog/2019/03/05/direct-gnss-external-receiver-support-in... blog post you can find an example of how you can use RMS horizontal accuracy values into a 95% confidence level.
For both built-in and external GNSS receivers, you can complement the reported horizontal accuracy with other commonly available location metadata such as the speed and also the position source type (Integrated GPS, external GPS, user-defined, etc). For a quick reference of other location metadata fields available, have a look at the https://community.esri.com/groups/survey123/blog/2016/11/03/extracting-information-from-geopoint-que... blog post.
If you use external location sensors, such as high accuracy GNSS receivers, then you will be able to get a lot more location metadata with Survey123 such as the fix type (GPS, differential GPS, RTK fixed, RTK float, SBAS...), differential age, number of satellites used, etc. The complete reference guide of all location metadata you can extract is in our Geopoints—Survey123 for ArcGIS | ArcGIS help topic.
Persisting the location accuracy as a GIS attribute is generally a good idea, but it does not help field users understand how to to get a better location with Survey123. Next, I will discuss a handful of techniques that will help end users actively contribute to higher location quality data.
Location Accuracy Threshold
The location accuracy threshold is an XLSLForm value expressed in meters. When the accuracy threshold is not met, the map panel in the survey will be automatically highlighted in red and the location icon will flash. This will give the field user a visual clue indicating that (1) a better location is desired and (2) that the Survey123 app is actively trying to get new locations to meet the threshold.
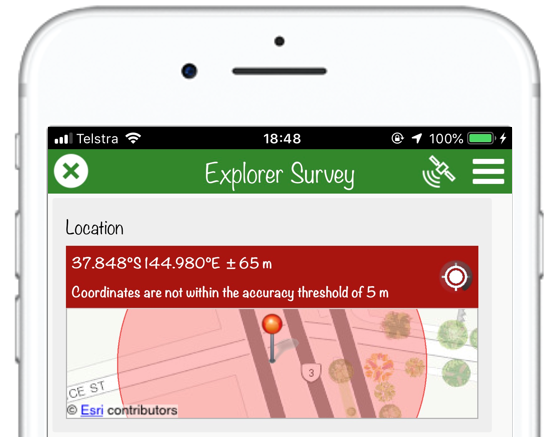
Setting the location accuracy threshold in your smart form is a very simple way to visually alert end users when the location is not considered accurate enough. A red map panel is an indication to end users that it is best to stay put and wait until the device is able to get a better location. If for whatever reason the device cannot get the desired accuracy, the end user can manually tap on the location icon to fix the geopoint.
The accuracy threshold is set, in meters, in the body::accuracyThreshold XLSForm column as shown below. This column accepts integers and decimals, but not XLSForm expressions. That is, the accuracy threshold is a fixed value.
| type | name | label | body::accuracyThreshold |
| geopoint | location | GPS Location | 5 |
It is important to train end users so they understand exactly what is happening when the map panel is red and the location icon flashes. While the location icon is flashing, Survey123 is actively retrieving new locations from the device. If the end user moves, the location will change! This is very different to the typical behavior of the Survey123 field app, which by default will immediately fix the location after the form is open.
A conservative value on your accuracy threshold, can help reduce situations where field users report location data that is clearly below the capabilities of their device. For example, when a device has been off for a while, the GPS may need some extra time to warm up before getting the best results. If you know that in normal conditions, you can get your devices to report horizontal accuracy in a range between 5 and 10 meters, then you can conservatively set the accuracy threshold to 20 meters. This will cause the map panel to turn red only in exceptional cases, letting the user know that it is best to stay put and wait a bit in order to let the device get a better fix. In normal conditions, the accuracy threshold will be met after a few seconds, the map panel will turn green and the location will be fixed. Figuring out such conservative value for the accuracy threshold requires some trial and error. It will vary depending on the range of devices used and average field conditions.
You can also go with a more aggressive approach where the accuracy threshold is set closer to the limits of what field conditions and your hardware can typically provide. In this case, you will be using the accuracy threshold to constantly remind end users of the importance of getting the best location possible. With an aggressive accuracy threshold value, some users may not be able to get a horizontal accuracy value below the threshold.
Always be aware that the location accuracy threshold value by itself will not prevent users from submitting data below the threshold. If you do not want data to be submitted unless a specific accuracy threshold is met, then you will need to use constraints. We will describe this later in this blog.
Location Quality Expressions
Using XLSForm syntax you can build sophisticated validation rules for location data. These XLSForm expressions can take into account the horizontal accuracy, and many other properties of your location data. You can also use other form data in your expressions. Here are some examples of location quality expressions you can build:
| XLSForm description | Description |
| ${speed}<0.2 | Speed is less than 0.2 meters per second. |
| ${positionSourceType}=3 | Location has been captured with an external location sensor |
| ${fixType}=4 and ${positionAccuracy}<1 | Location is RTK fixed and mean radial spherical error is less than 1 meter. |
| ${differentialAge}<3 | Location's differential age is less than 2 seconds |
You can use XLSForm expressions like the above in different contexts. For example, you can use them to show visual warnings to the field user using notes. See the https://community.esri.com/groups/survey123/blog/2017/11/14/understanding-notes-in-survey123 for details on using notes for this purpose.
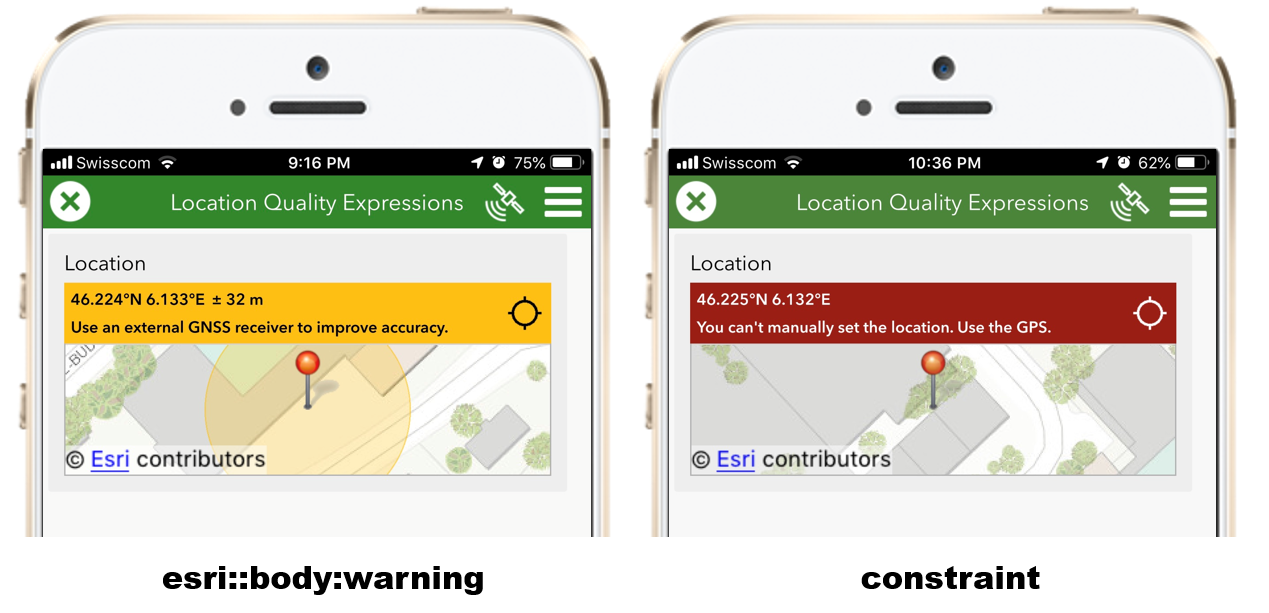
You can also use apply these expressions to the constraint and bind::esri:warning columns of a geopoint question. If you apply them to the constraint column, the end user will not be able to submit the survey unless the expression evaluates to true and the map panel will be highlighted in red. This is what is known as a hard constraint. If you apply them to the bind::esri:warning column, the map panel will be highlighted in yellow when the expression is not met. This will simply give end users a visual clue indicating that something is wrong with the location data. That is a soft constraint.
The contraint_message and bind::esri:warning_message columns are used to provide users with a specific error or warning message. Here is a complete example illustrating how to use the bind::esri:warning column to display a warning if the location has been captured while moving at a speed larger than 0.2 meters per second.
| type | name | label | calculation | bind::esri:warning | bind::esri:warning_message |
| geopoint | location | Location | ${speed}<0.2 | Please do not move while fixing the location | |
| calculate | speed | Speed | pulldata("@geopoint",${location},"speed") |
Typically, a location quality expression is going to validate some properties of your location data. For example, its speed, accuracy, etc. These properties are obtained through the pulldata() function. It is not good practice to combine the pulldata() function with any other XLSForm operator or function. In the example above, I created a calculate question to get the user speed from the geopoint object first, and then I referenced that value in the bind::esri:warning column. In this way, the pulldata() function is left alone in its own question avoiding any potential issues.
Expressions in bind::esri:warning define soft constraints. Even if the condition is not met, users will be allowed to submit the survey.
In the next example, I use the constraint column to apply a hard constraint. The user will not be able to submit the survey unless the accuracy is less than 1 meter and the fix type is RTK.
| type | name | label | calculation | constraint | constraint_message |
| geopoint | location | Location | ${fixtype}=4 and ${pa}<1 | RTK fix and sub-meter accuracy are required. | |
| calculate | fixtype | Fix | pulldata("@geopoint",${location},"fixType") | ||
| calculate | pa | PA | pulldata("@geopoint",${location},"positionAccuracy") |
In this example, I use a constraint to force users to use a GPS to set the location of the geopoint. If the user manually changes the location in the map, Survey123 will not let the submission go through.
| type | name | label | calculation | constraint | constraint_message |
| geopoint | location | Location | ${source}!=1 | You can't manually set the location. Use the GPS. | |
| calculate | source | Source | pulldata("@geopoint",${location},"positionSourceType") |
Expressions in the constraint and warning columns are evaluated every time the value of the question changes. If you add expressions to these columns in a geopoint question, they will get evaluated as soon as the location is updated.
Summary
A good smart form design can help field users capture better location data. Using XLSForm expressions we can actively check the quality of location data in the survey and provide users with clues to help correct issues. XLSForm expressions can also be used to prevent users from submitting location data that does not comply with our own business rules. Finally, XLSForm expressions allow us to store many location quality indicators as GIS attributes. This information is very valuable to support QA/QC workflows and before analysis and visualizations of the data are performed.
You must be a registered user to add a comment. If you've already registered, sign in. Otherwise, register and sign in.