- Home
- :
- All Communities
- :
- Products
- :
- ArcGIS Spatial Analyst
- :
- ArcGIS Spatial Analyst Questions
- :
- Re: Raster calculator won't add layers properly
- Subscribe to RSS Feed
- Mark Topic as New
- Mark Topic as Read
- Float this Topic for Current User
- Bookmark
- Subscribe
- Mute
- Printer Friendly Page
- Mark as New
- Bookmark
- Subscribe
- Mute
- Subscribe to RSS Feed
- Permalink
- Report Inappropriate Content
Hi there,
I'm having some difficulty adding raster layers. I'm trying to create a species richness map and I was thinking of layering them via the calculator. The files I have are individual species distributions (which are just patches of 1 grids), and I have a main raster of the map of the location (which are patches of 0 grids). Now, when I add the layers on raster calculator (irrespective of order), I end up with just the patches of 1 and the larger map just disappears. This would still happen if the values were 1 and 2 respectively, the grid cells for the main map would just disappear anyway.
What I want is to still have those grids with the value 0 so it would be uniform for all the species so I would be able to overlay all of them at once and get a map of the richness. The size of the cells are the same, and they are under the same projection. I just dont know what might be the reason.
Does anyone know why this happens/what I can do about it?
Any help would be greatly appreciated. Thank you.
Siri
Solved! Go to Solution.
Accepted Solutions
- Mark as New
- Bookmark
- Subscribe
- Mute
- Subscribe to RSS Feed
- Permalink
- Report Inappropriate Content
p, I suggest using the Cell Statistics tool with SUM option. That would run faster anyway. If you do have NoData issues there is a checkbox to ignore NoData in the SUM.
- Mark as New
- Bookmark
- Subscribe
- Mute
- Subscribe to RSS Feed
- Permalink
- Report Inappropriate Content
If there are areas of NoData in any of the grids, NoData will be returned, see the image here
- Mark as New
- Bookmark
- Subscribe
- Mute
- Subscribe to RSS Feed
- Permalink
- Report Inappropriate Content
the values are 0. So technically they should still be carried forward but it doesn't.
- Mark as New
- Bookmark
- Subscribe
- Mute
- Subscribe to RSS Feed
- Permalink
- Report Inappropriate Content
p, I suggest using the Cell Statistics tool with SUM option. That would run faster anyway. If you do have NoData issues there is a checkbox to ignore NoData in the SUM.
- Mark as New
- Bookmark
- Subscribe
- Mute
- Subscribe to RSS Feed
- Permalink
- Report Inappropriate Content
Hi Curtis,
I've tried the cell statistics tool but I'm facing another problem I can't seem to figure out:
This is basically my file, the blue being the Madagascar area (grid size around 590,000) and pink being species distribution.

However when I use the cell stat sum tool: it produces this raster. I dont know where the green square is coming from?
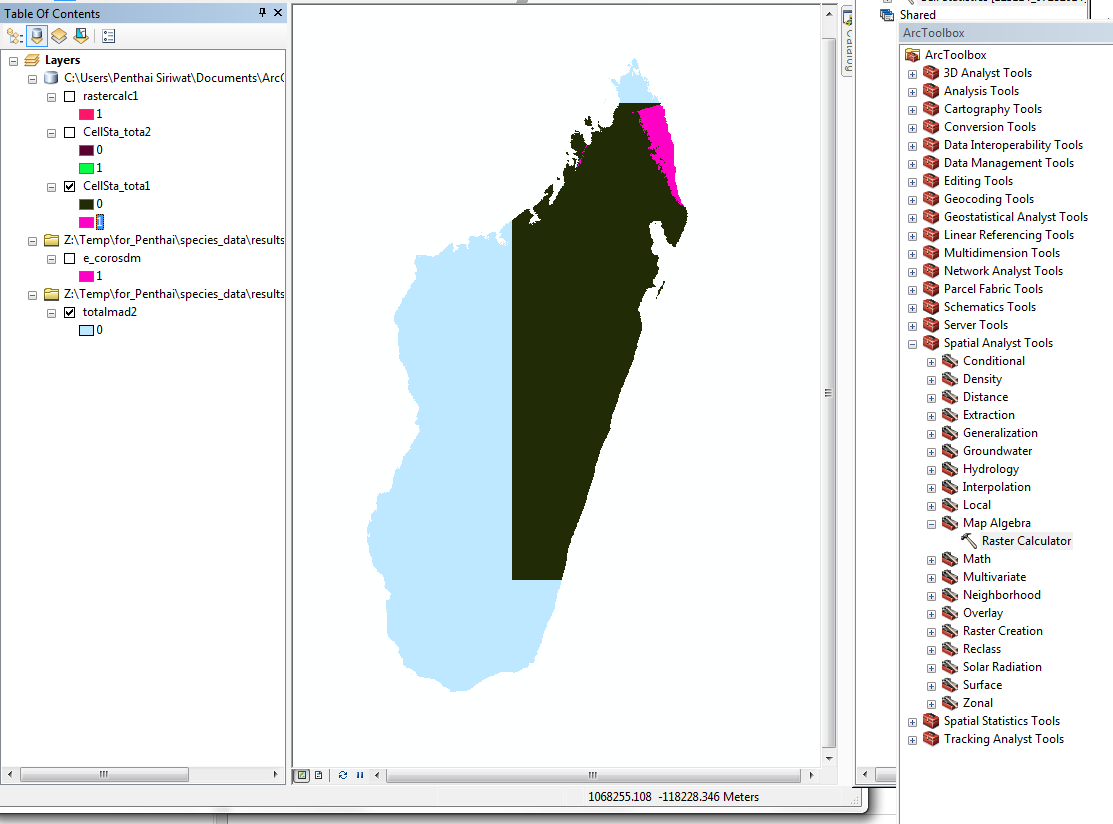
Would you know why this is happening?
thank you
Siri
- Mark as New
- Bookmark
- Subscribe
- Mute
- Subscribe to RSS Feed
- Permalink
- Report Inappropriate Content
Nevermind, I realised I didnt need the base raster afterall. So now its worked! Thank you!!