- Home
- :
- All Communities
- :
- Products
- :
- ArcGIS Spatial Analyst
- :
- ArcGIS Spatial Analyst Questions
- :
- How to identify the highest and lowest pixels with...
- Subscribe to RSS Feed
- Mark Topic as New
- Mark Topic as Read
- Float this Topic for Current User
- Bookmark
- Subscribe
- Mute
- Printer Friendly Page
How to identify the highest and lowest pixels within a defined neighborhood area of a central pixel
- Mark as New
- Bookmark
- Subscribe
- Mute
- Subscribe to RSS Feed
- Permalink
- Report Inappropriate Content
Hi,
I am using the 'range' statistics type within the 'focal statistics' tool. For each central pixel ArcGIS calculates the difference between the highest and lowest values in the defined neighborhood area and assigns it to the central pixel. What I am now looking for is a way to identify the highest and lowest pixels within that defined neighborhood area.
Any help is much appreciated.
Regards,
Fidel
- Mark as New
- Bookmark
- Subscribe
- Mute
- Subscribe to RSS Feed
- Permalink
- Report Inappropriate Content
So, let me get this straight, for every 3x3 moving window, you want the location of the min within that moving window?
Lets look at the top 6 rows and columns. Here they are in array form. Array 'a' is the original dem, with the top row being a nodata row)
a[:6, :6] # original dem with nodata row
array([[-32768, -32768, -32768, -32768, -32768, -32768],
[ 619, 606, 592, 581, 569, 580],
[ 602, 592, 581, 572, 563, 579],
[ 579, 571, 563, 563, 564, 583],
[ 552, 551, 549, 562, 575, 592],
[ 537, 549, 561, 575, 590, 600]], dtype=int16)
amin[:6, :6] # minimum using a 3x3 moving window
array([[606, 592, 581, 569, 569, 569],
[592, 581, 572, 563, 563, 563],
[571, 563, 563, 563, 563, 563],
[551, 549, 549, 549, 562, 563],
[537, 537, 549, 549, 562, 564],
[537, 537, 549, 549, 562, 575]], dtype=uint16)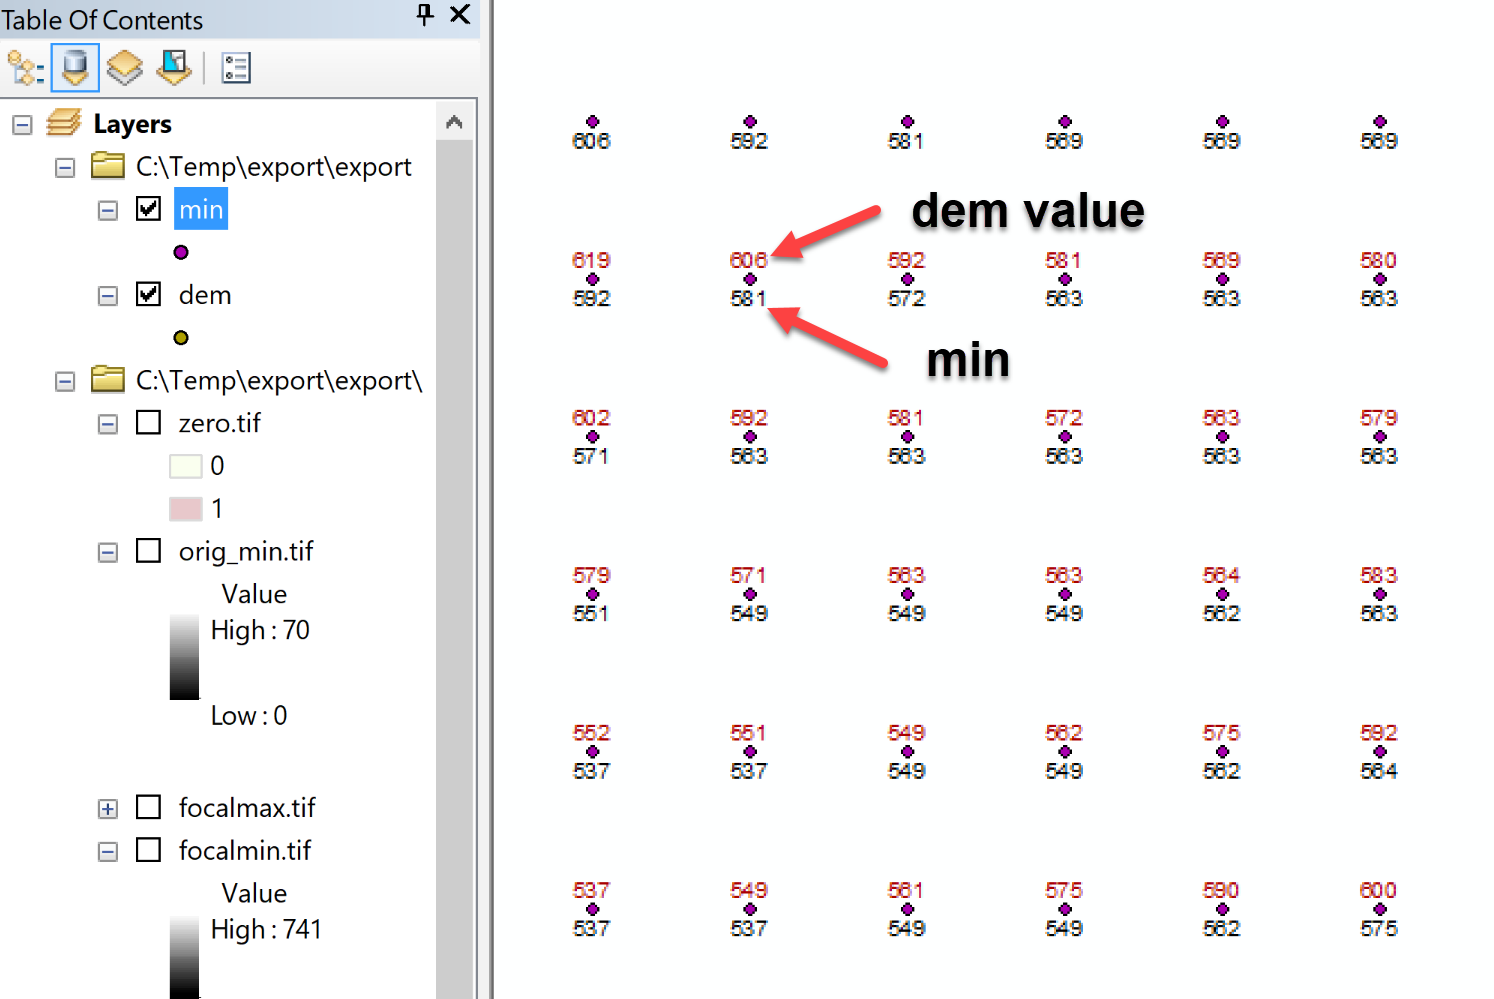
Now for the top 3x3 window, the minimum is 581 as can be seen by what is returned by the focal min. Do you want the location of the minimum? Since there are 2 locations for that one core cell as you will notice. Do you want the one on the top row, 3rd column or the 581 on the 3rd row, 3rd column... or both. It makes a difference, but is doable, if you can explain why that precision in location is needed.
So... if none of that applies, what is the number you want in the example above.
- Mark as New
- Bookmark
- Subscribe
- Mute
- Subscribe to RSS Feed
- Permalink
- Report Inappropriate Content
Thanks Dan. Yes, for every moving window I want the location of the minimum cell in the original raster (not in the focal min raster).
In the above example if we look at the array of the original raster, for the top 3x3 window (central cell 606 in original raster) the minimum is 581 and its location in the original raster is 3rd row and 3rd column. For the next 3x3 window moving to the right (central cell 592 in original raster) the minimum is 572 and its location in the original raster is 3rd row and 4th column.
But if it happens that there are 2 minimum values within a 3x3 window in the original raster, then I would want to know the locations of both.
The reason for wanting to know the exact location of the minimum values is that I will later use criteria to screen those locations in terms of their (terrain's) suitability to construct a reservoir at those locations.
I hope this helps.
- Mark as New
- Bookmark
- Subscribe
- Mute
- Subscribe to RSS Feed
- Permalink
- Report Inappropriate Content
That methodology would effectively give you a potential location which may only represent an area of 3x3 cells, with no other possible contribution from other cells. So unless you are looking for micro-resevoirs, this approach won't lead to the location in that study area which would maximize the collection of water and minimize the number of reservoirs to be constructed.
Where on that map would you expect those features to be constructed as a rough guide?
- Mark as New
- Bookmark
- Subscribe
- Mute
- Subscribe to RSS Feed
- Permalink
- Report Inappropriate Content
The 3x3 window is just as an example. My real neighborhood window is going to have a radius of few kilometers. By having a moving window I am making sure that there is an overlap between the windows resulting in combinations of min or max locations from different windows.
My aim at this point is just to find the areas where there is level difference (using the focal range tool) and locate the highest and lowest points. As mentioned above, I will later apply other criteria to determine their suitability to construct reservoirs, nearness to water sources...etc.
The raster I sent you is just a very small part of my input DEM. My real DEM is as big as a country the size of Germany.
- Mark as New
- Bookmark
- Subscribe
- Mute
- Subscribe to RSS Feed
- Permalink
- Report Inappropriate Content
Then you need to use block values and return the minimum location within each block.
Assuming that the sample data you sent represents your moving/block window size, then the following would apply.
block size 128 rows x 229 columns
minimum value 355
location within block 113, 226
Now as the block moves over another 128 columns a new min is located and its location.
At the end of this you will have the location ... or locations of the minimum within each block.
This is the only way you can maintain the cell size while finding the minimum within each block.
At the end, your whole study area will have a bunch of values... but if you want to locate dams for reservoirs, you would have been better off using the Hydro tools and determine the subbasins and stream network within.
am_msk = np.ma.masked_values(a, value=msk0) # input array accounting for nodata values
am_msk.shape # the number of rows and columns of your 'block window'
(128, 229)
min_val = np.nanmin(am_msk) # the minimum value in the block
min_val
355
loc = np.where(am_msk == min_val) # the row, column location within that block
loc
(array([113], dtype=int64), array([226], dtype=int64))
- Mark as New
- Bookmark
- Subscribe
- Mute
- Subscribe to RSS Feed
- Permalink
- Report Inappropriate Content
This thread has triggered my attention and I wanted to try something, just to get an idea of what we are talking about.
I created a python script that evaluates the largest drop in a moving window of 5x5 (still pretty small) to see what is possible, using a small extent of the data:
I converted the DEM into a point file and added the row and column numbers to it using the ($$RowMap and $$ColMap) in Python followed by the Extract Multivalues to Points tool.
Based on that data I created the script below where it travers through each center pixel (point) and extracts the values of the 5x5 neighborhood. It determines the min and max values and corresponding locations and generates a 3D polyline with attributes on drop (max - min) and some other stats.
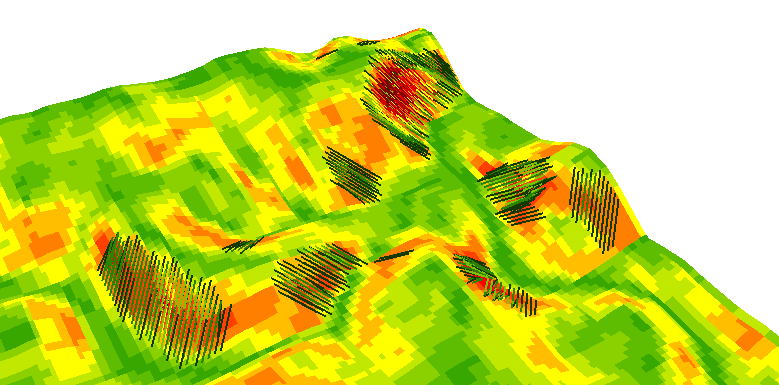
If I color the lines by drop value and apply a minimum drop for the polyline to be generated (25m) this is the result:
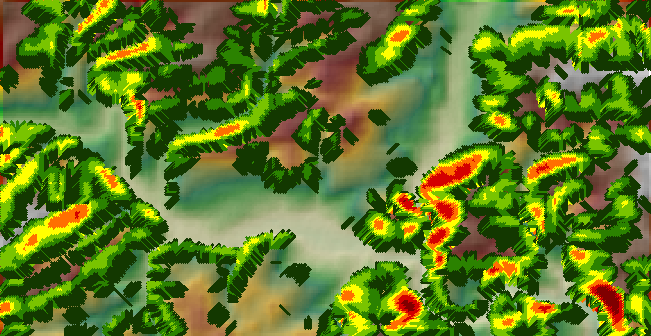
I you look at a part of the area closer (showing only the largest drop values) you can see the effect:
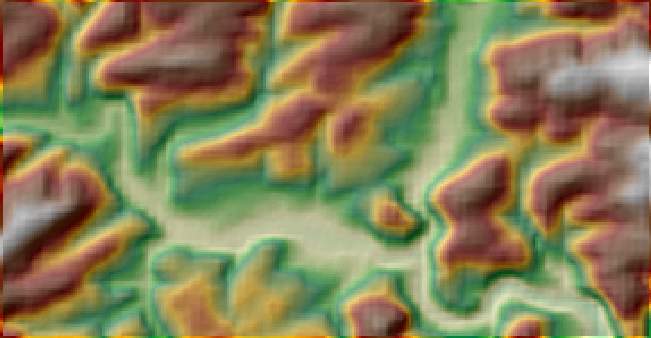
Comparing it to a simple slope map:

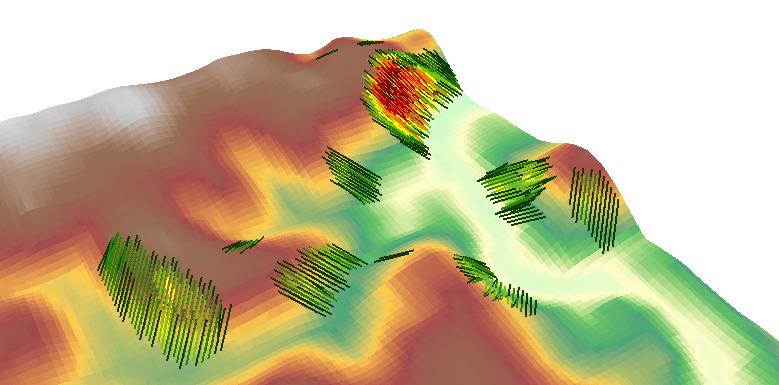
and the lines on top of the slope raster
The code I used for this is listed below:
#-------------------------------------------------------------------------------
# Name: hydropower2.py
# Purpose:
#
# Author: Xander
#
# Created: 05-06-2017
#-------------------------------------------------------------------------------
def main():
import arcpy
import os
arcpy.env.overwriteOutput = True
fc = r'C:\GeoNet\HydroPower\data.gdb\points_dem_small'
fld_dem = 'grid_code'
fld_row = 'row'
fld_col = 'col'
fc_out = r'C:\GeoNet\HydroPower\data.gdb\drop_lines3'
fld_minh = "MinHeight"
fld_maxh = "MaxHeight"
fld_drop = "DropHeight"
fld_slope = "Slope"
# settings
min_drop = 25
# create a featureclass and fill with drop line
ws, fc_name = os.path.split(fc_out)
sr = arcpy.Describe(fc).spatialReference
arcpy.CreateFeatureclass_management(ws, fc_name, "POLYLINE", None, "DISABLED", "ENABLED", sr)
arcpy.AddField_management(fc_out, fld_minh, "DOUBLE")
arcpy.AddField_management(fc_out, fld_maxh, "DOUBLE")
arcpy.AddField_management(fc_out, fld_drop, "DOUBLE")
arcpy.AddField_management(fc_out, fld_slope, "DOUBLE")
flds = (fld_row, fld_col, fld_dem, 'SHAPE@')
dct = {'r{0}c{1}'.format(r[0], r[1]): (r[2], r[3]) for r in arcpy.da.SearchCursor(fc, flds)}
rows = max([r[0] for r in arcpy.da.SearchCursor(fc, (fld_row))])
cols = max([r[0] for r in arcpy.da.SearchCursor(fc, (fld_col))])
print "rows:", rows
print "cols:", cols
flds = ('SHAPE@', fld_minh, fld_maxh, fld_drop, fld_slope)
with arcpy.da.InsertCursor(fc_out, flds) as curs:
cnt = 0
drop_max = 0
for r in range(1, rows + 1):
for c in range(1, cols + 1):
cnt += 1
if cnt % 5000 == 0:
print "Processing", cnt
lst = getListNeighbors(dct, r, c, rows, cols)
min_val = getmin(lst)
max_val = getmax(lst)
drop = max_val - min_val
lst_pos_min = getPositions(lst, min_val)
lst_pos_max = getPositions(lst, max_val)
if drop >= min_drop:
min_d = 25
for pos_min in lst_pos_min:
for pos_max in lst_pos_max:
d = RelativeDistance(pos_min, pos_max)
if d < min_d:
min_d = d
pos_h = pos_max
pos_l = pos_min
polyline = CreatePolyline(lst, pos_h, pos_l)
curs.insertRow((polyline, min_val, max_val, drop, float(drop)/float(d), ))
if drop > drop_max:
drop_max = drop
print
print "drop_max:", drop_max
def CreatePolyline(lst, pos_h, pos_l):
tpl_h = GetItemOnTuple(lst, pos_h)
tpl_l = GetItemOnTuple(lst, pos_l)
pntg1 = tpl_h[1]
pntg2 = tpl_l[1]
sr = pntg1.spatialReference
pnt1 = pntg1.firstPoint
pnt1.Z = tpl_h[0]
pnt2 = pntg2.firstPoint
pnt2.Z = tpl_l[0]
return arcpy.Polyline(arcpy.Array([pnt1, pnt2]), sr, True, False)
def GetItemOnTuple(lst, tpl):
x = tpl[0]
y = tpl[1]
index = (-1*y+2)*5 + x + 2
return lst[index]
def RelativeDistance(tpl1, tpl2):
import math
return math.hypot(tpl1[0] - tpl2[0], tpl1[1] - tpl2[1])
def getmin(lst):
lst2 = [a[0] for a in lst if a[0] != None]
return min(lst2)
def getmax(lst):
lst2 = [a[0] for a in lst if a[0] != None]
return max(lst2)
def getPositions(lst, val):
positions = []
for r in range(5):
for c in range(5):
positions.append((c-2, -1*(r-2)))
result = []
for i in range(25):
if val == lst[i][0]:
result.append(positions[i])
return result
def getListNeighbors(dct, ri, ci, rows, cols):
lst = []
prn = True
for r in range(ri - 2, ri + 3):
for c in range(ci - 2, ci + 3):
rc = 'r{0}c{1}'.format(r, c)
if rc in dct:
lst.append(dct[rc])
else:
prn = False
lst.append((None, None))
return lst
if __name__ == '__main__':
main()You could apply this to larger moving windows, but I'm still not convinced by it...
- Mark as New
- Bookmark
- Subscribe
- Mute
- Subscribe to RSS Feed
- Permalink
- Report Inappropriate Content
largest drop is useful... hasn't been an implementation since Eppl7 (waaaaay back). Often, it is the largest drop that is needed and not the D8 or other slope calculations. Now I will have to dredge up some stuff I worked on last year. When I get some time, I will update the Nu. Re with sabbatical musings on surface derivatives
- Mark as New
- Bookmark
- Subscribe
- Mute
- Subscribe to RSS Feed
- Permalink
- Report Inappropriate Content
Would be great Dan_Patterson , please share !
- Mark as New
- Bookmark
- Subscribe
- Mute
- Subscribe to RSS Feed
- Permalink
- Report Inappropriate Content
Here's what worked for me:
1) I reclassified my raster and assigned "NoData" value to all classes except for the last one which had the highest cell values. Displaying this reclassified raster on my original raster helped identify regions which had the highest cell values.
2) Used the Extract By Attributes tool and created an SQL query to output pixel(s) with highest value.
I had one specific cell with the highest value and it naturally fell in the region covered by the raster in step 2, and was easy to spot.
- « Previous
- Next »
- « Previous
- Next »