- Home
- :
- All Communities
- :
- Products
- :
- ArcGIS Spatial Analyst
- :
- ArcGIS Spatial Analyst Questions
- :
- How to identify the highest and lowest pixels with...
- Subscribe to RSS Feed
- Mark Topic as New
- Mark Topic as Read
- Float this Topic for Current User
- Bookmark
- Subscribe
- Mute
- Printer Friendly Page
How to identify the highest and lowest pixels within a defined neighborhood area of a central pixel
- Mark as New
- Bookmark
- Subscribe
- Mute
- Subscribe to RSS Feed
- Permalink
- Report Inappropriate Content
Hi,
I am using the 'range' statistics type within the 'focal statistics' tool. For each central pixel ArcGIS calculates the difference between the highest and lowest values in the defined neighborhood area and assigns it to the central pixel. What I am now looking for is a way to identify the highest and lowest pixels within that defined neighborhood area.
Any help is much appreciated.
Regards,
Fidel
- Mark as New
- Bookmark
- Subscribe
- Mute
- Subscribe to RSS Feed
- Permalink
- Report Inappropriate Content
Unfortunately Focal flow and Flow Direction are not working for me.
- Mark as New
- Bookmark
- Subscribe
- Mute
- Subscribe to RSS Feed
- Permalink
- Report Inappropriate Content
How about Block Statistics? This works with neighborhoods that do not overlap. I suspect this still isn't what you want though, since this is around the central cell again. Can you explain your use case -- what exactly are trying to do?
# Cells that are the lowest of the 3x3 around that cell
Con(BlockStatistics("in_grid", "", "MINIMUM") == "in_grid"), "in_grid")
# Cells that are the highest of the 3x3 around that cell
Con(BlockStatistics("in_grid", "", "MAXIMUM") == "in_grid", "in_grid")All these Spatial Analyst raster operators output values of the central cell of a window, if the procedure Xander Bakker suggests (messing with FocalFlow) won't do it, it seems likely Dan Patterson's suggestion of numpy arrays is the only way to do what you want. There is a useful cookbook in the help on how to do cell by cell neighborhood stuff in numpy:
NumPyArrayToRaster—Help | ArcGIS Desktop
Back in the day, Spatial Analyst (ArcInfo Workstation GRID) supported neighorhood notation, but it was pretty slow and limited, this functionality is now covered by working with numpy arrays.
- Mark as New
- Bookmark
- Subscribe
- Mute
- Subscribe to RSS Feed
- Permalink
- Report Inappropriate Content
Dan_Patterson, curtvprice, xander_bakker
I am trying to find upper and lower reservoir locations for potential pumped storage hydropower sites in a large area. My input is a Digital Elevation Model. So if I use a non-overlapping neighborhood, I will miss many possible upper and lower reservoir combinations in which one of the reservoirs lies in one neighborhood and the other reservoir in the adjacent neighborhood.
I am not familiar with NumPy Arrays and would really appreciate any help.
Thanks
Fidel
- Mark as New
- Bookmark
- Subscribe
- Mute
- Subscribe to RSS Feed
- Permalink
- Report Inappropriate Content
Image of what you are working with would help....
We are either not talking about the same thing, since both my suggestions will work, or your error in location would be one whole cell size width.
If need be, zip and save a portion... not the whole thing... to a raster maybe in *.tif format, so I can demonstrate how to do it with real data as either a raster/grid or numpy array.
- Mark as New
- Bookmark
- Subscribe
- Mute
- Subscribe to RSS Feed
- Permalink
- Report Inappropriate Content
Do you mean image of a typical pumped storage hydropower site?
- Mark as New
- Bookmark
- Subscribe
- Mute
- Subscribe to RSS Feed
- Permalink
- Report Inappropriate Content
Whatever this is ....
What I am now looking for is a way to identify the highest and lowest pixels within that defined neighborhood area.
It is a raster I presume... or the question doesn't make sense
- Mark as New
- Bookmark
- Subscribe
- Mute
- Subscribe to RSS Feed
- Permalink
- Report Inappropriate Content
- Mark as New
- Bookmark
- Subscribe
- Mute
- Subscribe to RSS Feed
- Permalink
- Report Inappropriate Content
Sorry didn't read your whole message when I when I sent the previous reply. Will send it.
- Mark as New
- Bookmark
- Subscribe
- Mute
- Subscribe to RSS Feed
- Permalink
- Report Inappropriate Content
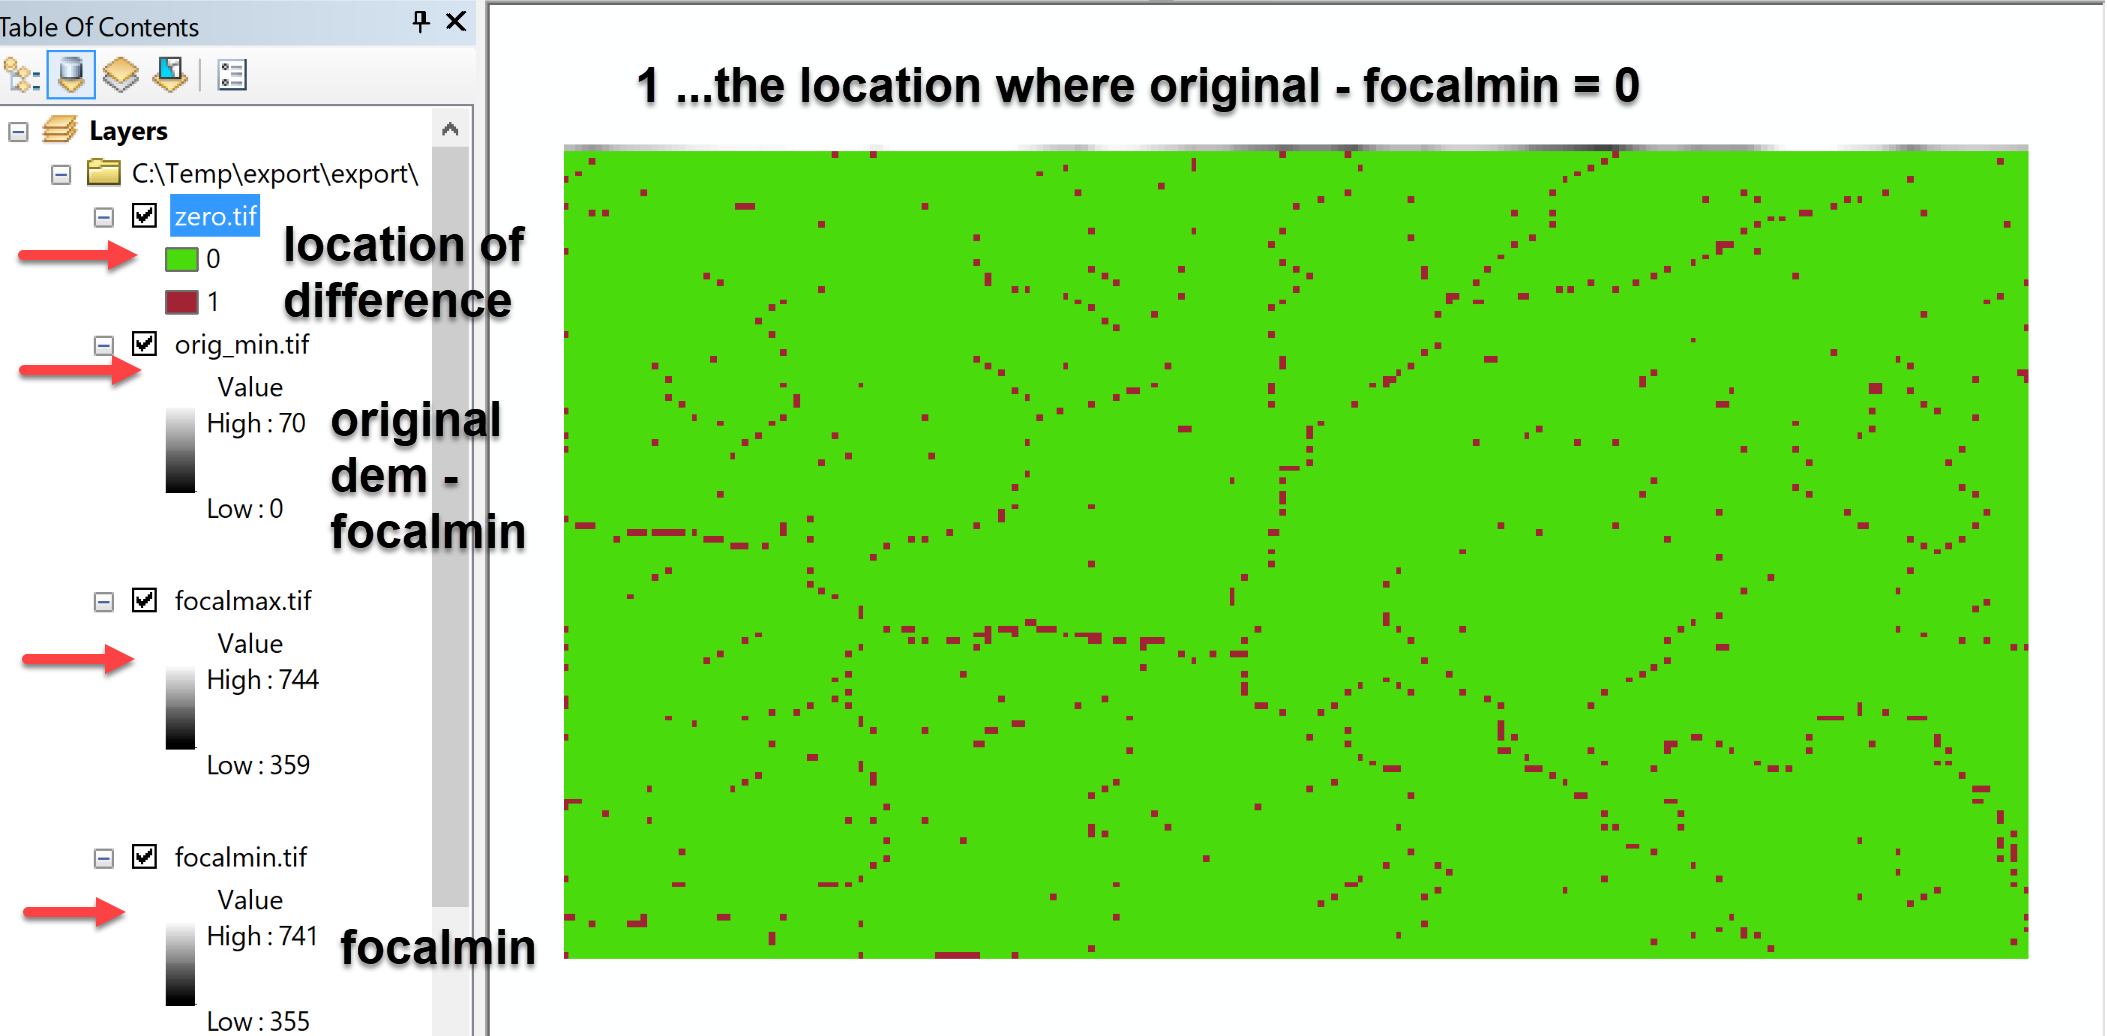
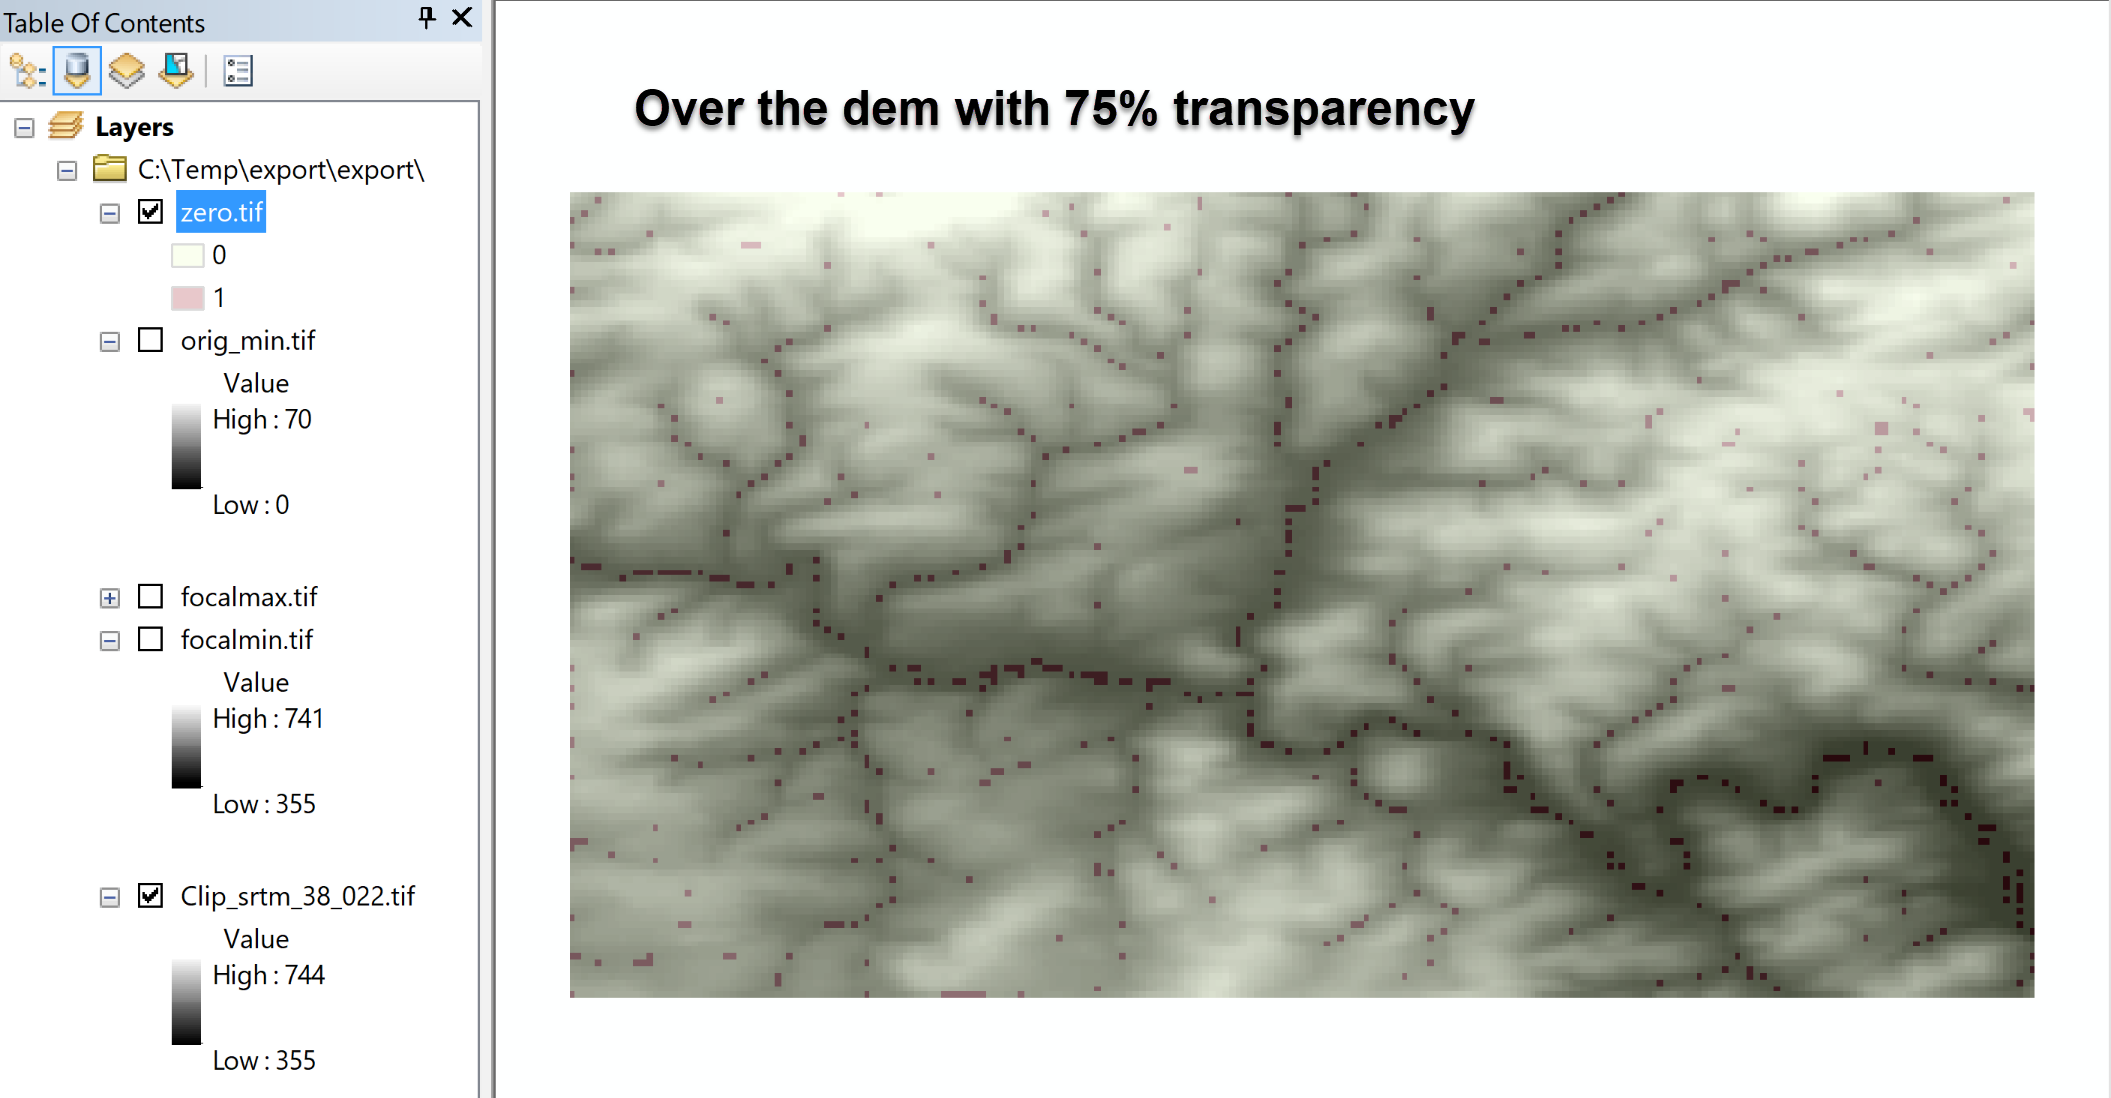
Is this what you are looking for?
Over the DEM with transparency
- Mark as New
- Bookmark
- Subscribe
- Mute
- Subscribe to RSS Feed
- Permalink
- Report Inappropriate Content
This is not what I am looking for. This is the original raster minus the Focal Min raster. As explained in one of my posts above this is not giving me what I am looking for. I am looking for the location of the min or max for each central cell. That means the number of min or max locations to be identified must be equal to the number of cells in the original raster.