Turn on suggestions
Auto-suggest helps you quickly narrow down your search results by suggesting possible matches as you type.
Cancel
- Home
- :
- All Communities
- :
- Products
- :
- ArcGIS Spatial Analyst
- :
- ArcGIS Spatial Analyst Questions
- :
- Re: Focal Statistics sum
Options
- Subscribe to RSS Feed
- Mark Topic as New
- Mark Topic as Read
- Float this Topic for Current User
- Bookmark
- Subscribe
- Mute
- Printer Friendly Page
Focal Statistics sum
Subscribe
659
5
05-11-2011 11:21 AM
05-11-2011
11:21 AM
- Mark as New
- Bookmark
- Subscribe
- Mute
- Subscribe to RSS Feed
- Permalink
- Report Inappropriate Content
Hello,
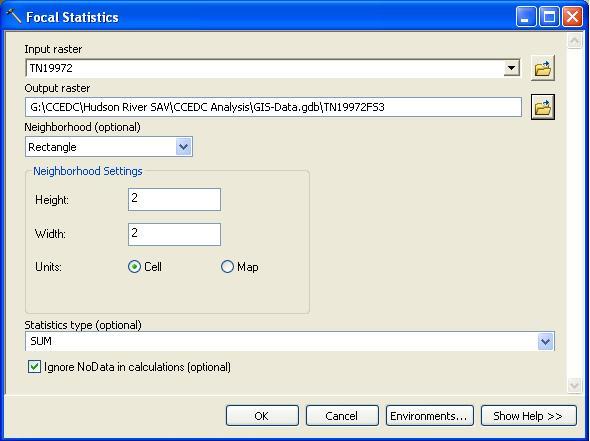
Just running a simple focal statistics analysis on a grid surface of vegetation density, summing up values for each cell within 2 nearest neighbors (rectangle) in the width and height. The tool runs fine, but the sums in the output raster for each cell don't jive with what's in the input raster. For example, one cell in the input raster has a value of 3,239. The value of that cell in the output raster should be the sum of the cells in the surrounding 2-cell rectangular neighborhood, but it is far less (12,038) than what it should be. In fact, the sum of the values in just 1 nearest neighbor, which I calculated manually, would be much more (39,002). I've run the tool several times (screenshot attached). Is there just something I don't understand about the way this tool works, or did I set something up wrong?
thanks,
-Neil
5 Replies
05-11-2011
11:54 AM
- Mark as New
- Bookmark
- Subscribe
- Mute
- Subscribe to RSS Feed
- Permalink
- Report Inappropriate Content
Did you ensure that the exact same cell size and extent as the input raster was used? Check in the Environments tab for any tool that you use in Arctoolbox...sometimes they don't stick.
05-11-2011
01:04 PM
- Mark as New
- Bookmark
- Subscribe
- Mute
- Subscribe to RSS Feed
- Permalink
- Report Inappropriate Content
Thanks for your response. Just tried it with Processing Extent, XY Resolution, and Cell Size (under Raster Analysis) explicitly set. Same result.
05-11-2011
09:56 PM
- Mark as New
- Bookmark
- Subscribe
- Mute
- Subscribe to RSS Feed
- Permalink
- Report Inappropriate Content
The two nearest cells would be 5 x 5 neighborhood:
o o o o o
o o o o o
o o x o o
o o o o o
o o o o o
a 2 x 2 neighborhood probably looks more like this:
o o
x o
o o o o o
o o o o o
o o x o o
o o o o o
o o o o o
a 2 x 2 neighborhood probably looks more like this:
o o
x o
05-12-2011
03:55 AM
- Mark as New
- Bookmark
- Subscribe
- Mute
- Subscribe to RSS Feed
- Permalink
- Report Inappropriate Content
To echo, what Curtis mentioned. Take a look at the help documentation for the tool to understand what you should be comparing.
If you are looking for someone to break it down with you, to see exactly what may be occurring, I encourage you to create a Support Incident and the Analyst should be able to explain it.
-----------------------------------------------------------------------------------------------------------------------
Rectangle
The x,y position for the processing cell within the neighborhood, with respect to the upper left corner of the neighborhood, is determined by the following equations:
x = (width of the neighborhood + 1)/2
y = (height of the neighborhood + 1)/2
If the input number of cells is even, the x,y coordinates are computed using truncation.
For example, in a 5 x 5 cell neighborhood, the x- and y-values are 3,3. In a 4 x 4 neighborhood, the x- and y-values are 2,2.
The units for the width and height values can be defined in cells or in map units.
Focal statistics with rectangle neighborhood illustration
05-16-2011
12:44 PM
- Mark as New
- Bookmark
- Subscribe
- Mute
- Subscribe to RSS Feed
- Permalink
- Report Inappropriate Content
Right. Makes perfect sense now looking back at the language - width and height. What made intuitive sense to me was distance from the cell, and I just couldn't see beyond how I thought this was *supposed* to work.
This article in the help explains it well, had I bothered to dig a little deeper:
http://help.arcgis.com/en/arcgisdesktop/10.0/help/index.html#/How_Focal_Statistics_works/009z000000r...
Thanks for clearing this up for me.
-Neil
This article in the help explains it well, had I bothered to dig a little deeper:
http://help.arcgis.com/en/arcgisdesktop/10.0/help/index.html#/How_Focal_Statistics_works/009z000000r...
Thanks for clearing this up for me.
-Neil