- Home
- :
- All Communities
- :
- Products
- :
- ArcGIS Spatial Analyst
- :
- ArcGIS Spatial Analyst Questions
- :
- Re: Con statement with raster calculator
- Subscribe to RSS Feed
- Mark Topic as New
- Mark Topic as Read
- Float this Topic for Current User
- Bookmark
- Subscribe
- Mute
- Printer Friendly Page
- Mark as New
- Bookmark
- Subscribe
- Mute
- Subscribe to RSS Feed
- Permalink
- Report Inappropriate Content
Hi all,
I would like to know if there is a way to perform a conditional raster calculation between two layers A and B.
I would like to have the following conditions:
If (inRastA <= 43) (condition 1) and (inRastB> = 42) (condition2) and (inRastA+inRastB <= 85) (condition3), then the result is (ouRast = 86), otherwise (inRastA+inRastB).
How can I write this statement within the Raster Calculator?
Below the same example written in Excel
=IF(And(A1<=43; B1>=42; O1<=85);86;O1+B1)
Regards!
Solved! Go to Solution.
Accepted Solutions
- Mark as New
- Bookmark
- Subscribe
- Mute
- Subscribe to RSS Feed
- Permalink
- Report Inappropriate Content
Could you please try this:
Con(("inRastA" <= 43) & ("inRastB" >= 42) &(("inRastA" + "inRastB") <=85),86, ( "inRastA" + "inRastB"))
- Mark as New
- Bookmark
- Subscribe
- Mute
- Subscribe to RSS Feed
- Permalink
- Report Inappropriate Content
You have obviously found the Con tool. Save us some time and post what you have so far.
edit: the short answer to your first question is, yes, it is possible to do this using Con. 
- Mark as New
- Bookmark
- Subscribe
- Mute
- Subscribe to RSS Feed
- Permalink
- Report Inappropriate Content
Hi Darren,
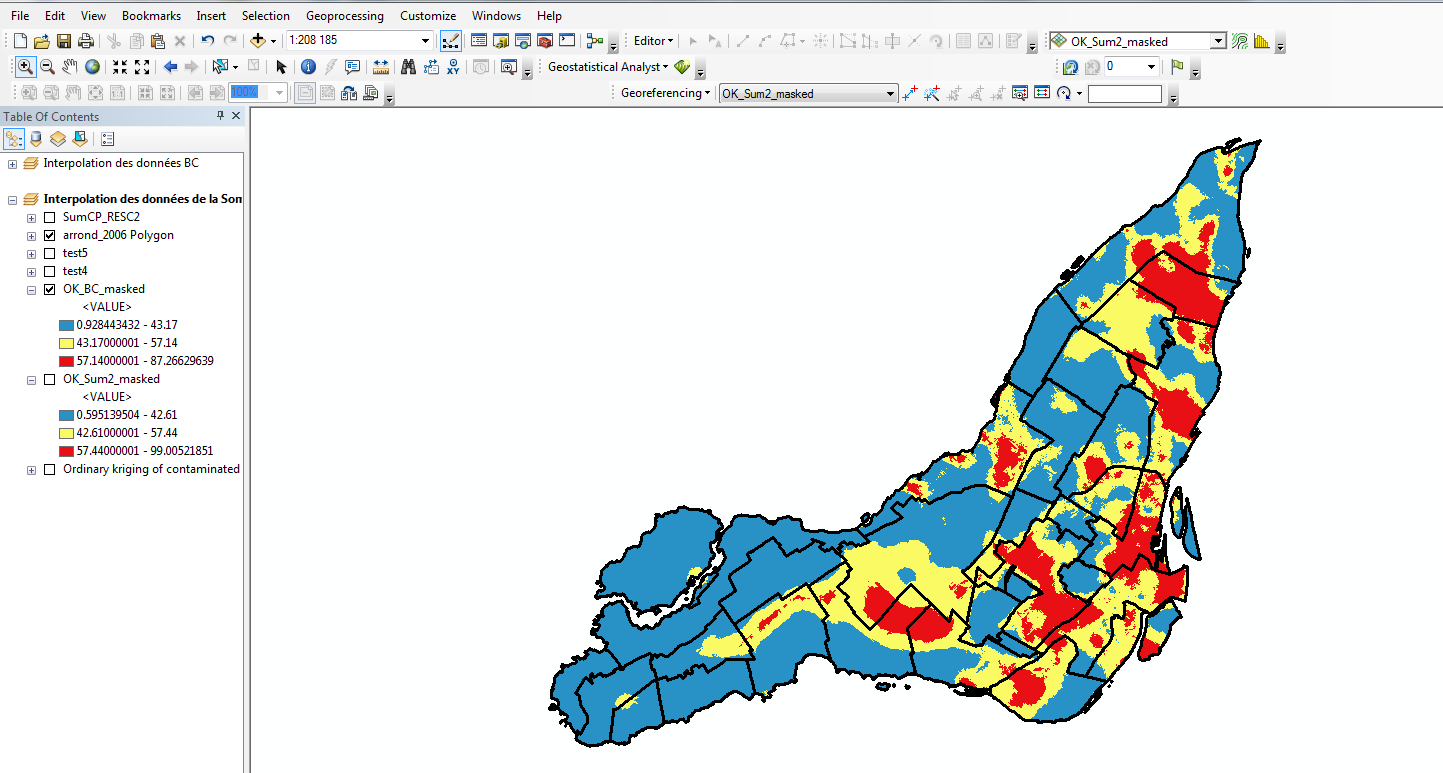
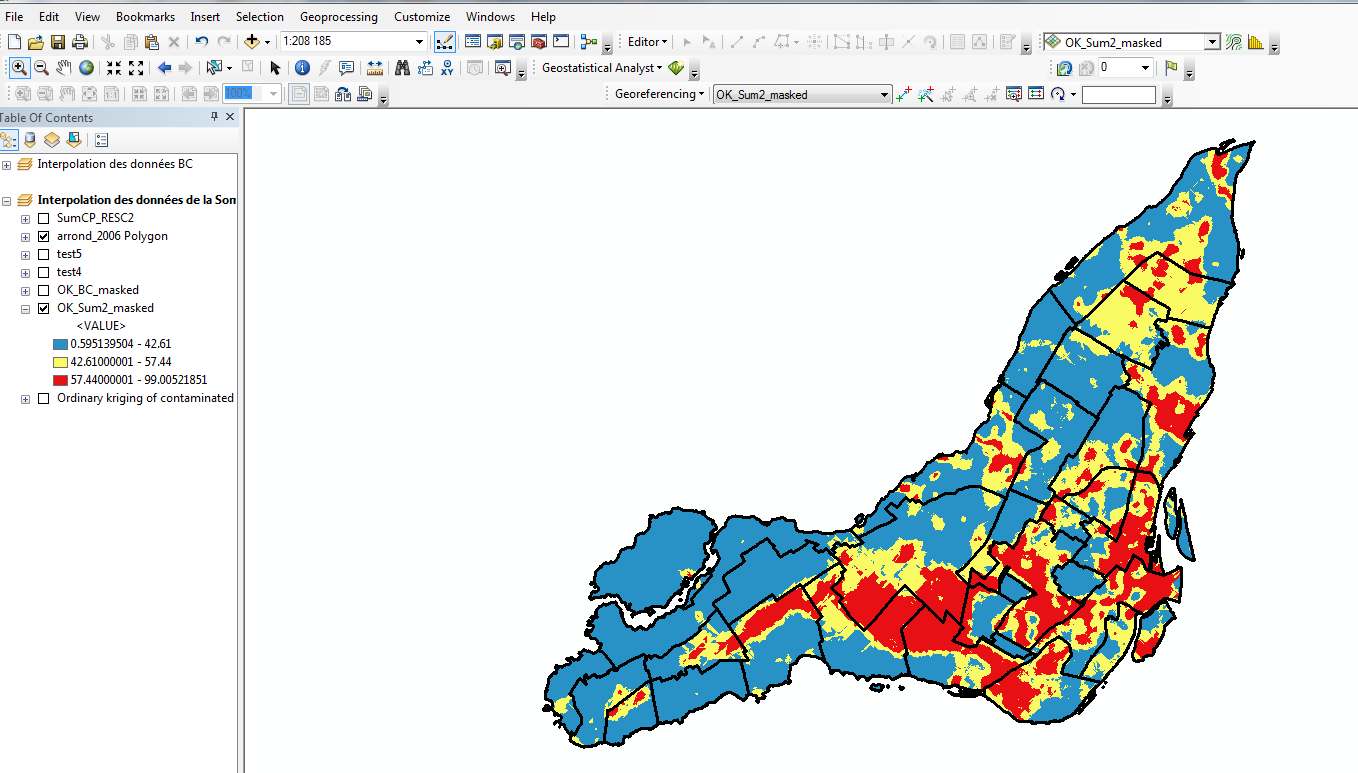
To be more explicit, we generated two interpolation grids using the kriging method for contaminated soils from two groups among ala contaminated soil classification scheme adopted by the Ministry of Environment of Quebec. The soils of the BC class (contaminated) represents the interpolated surface grid for this class. The second class represents C + and C + RESC soil very contaminated.
After interpolation of the two categories that represent the same sampling point, we wanted to overlay the two grids to get a final grid that gives us an overall picture of the contamination.
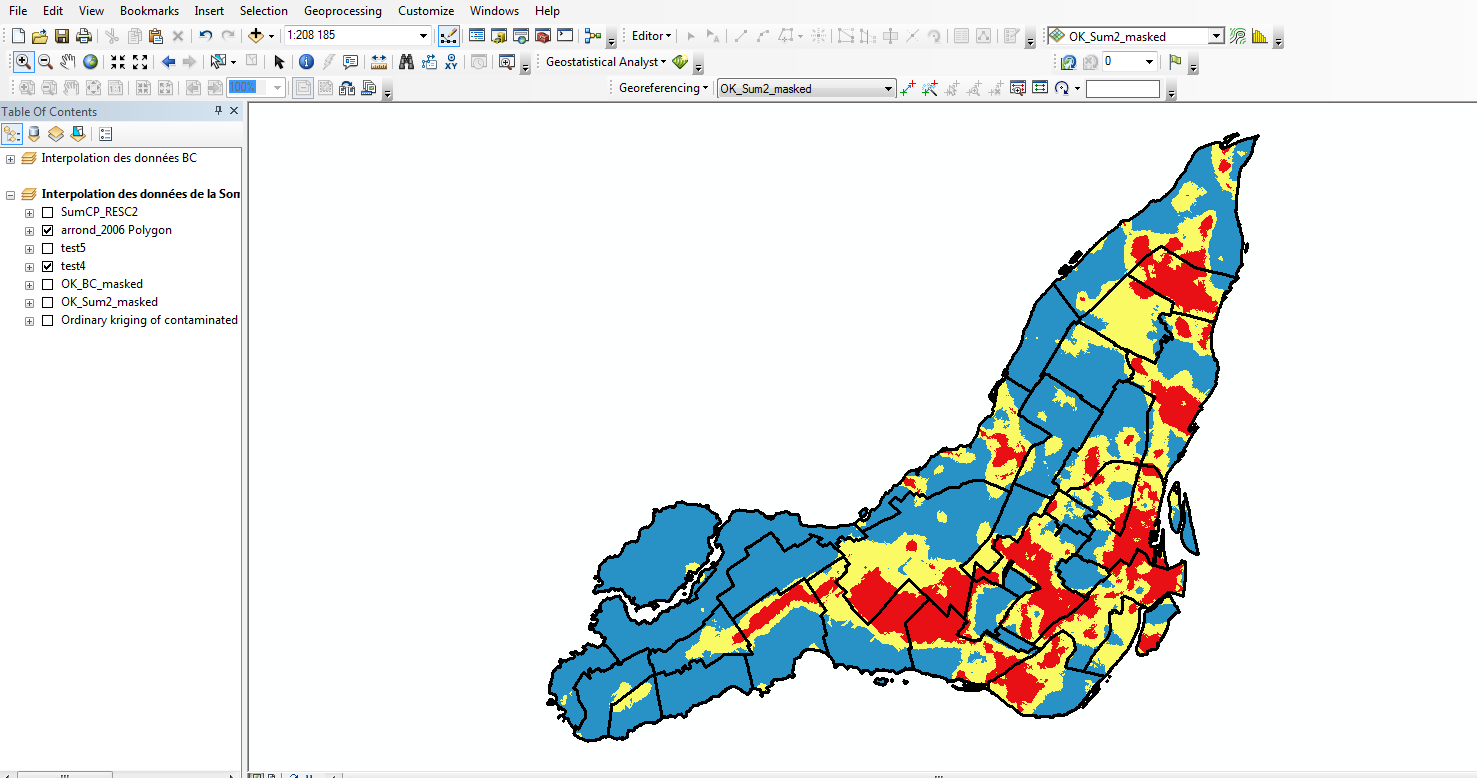
For this, we performed a classification of pixel values, according to three classes, based on the class limits determined by the statistics obtained for the soils of the BC class and C + and C + RESC. By performing the overlaid of two raster layers, we would like to have the pixel values of the BC layers and C + and C + RESC that fulfill the criteria we determined. The result of the Con is depected by the last image.
See attachment below.
Regards
 on
on
- Mark as New
- Bookmark
- Subscribe
- Mute
- Subscribe to RSS Feed
- Permalink
- Report Inappropriate Content
Try this:
Con(("inRastA" <= 43") & ("inRastB" >= 42) & ("inRastA" + "inRastB") <=85, "ouRast" == 86, "inRastA" + "inRastB")
Hope it works
- Mark as New
- Bookmark
- Subscribe
- Mute
- Subscribe to RSS Feed
- Permalink
- Report Inappropriate Content
Hi Eti,
Thank for your answer. I've tried the Con argument you pointed me out based on the criterion we determined to overlay the two raster grid we generaeted. Curiously, I get the same result as a simple addition operation between the two layers. View the files attached to the answer of Darren post.
I'm wondering if our reasoning does make sense?
Thank again for your help
- Mark as New
- Bookmark
- Subscribe
- Mute
- Subscribe to RSS Feed
- Permalink
- Report Inappropriate Content
Could you please try this:
Con(("inRastA" <= 43) & ("inRastB" >= 42) &(("inRastA" + "inRastB") <=85),86, ( "inRastA" + "inRastB"))
- Mark as New
- Bookmark
- Subscribe
- Mute
- Subscribe to RSS Feed
- Permalink
- Report Inappropriate Content
Hi Kishore,
Thank for the example you provide. I'll will try it soon and I'll get back to you soon...
ReRegards!
Tahir Tamba
6632, Avenue de Gaspé
Montréal, H2S 2Y2
- Mark as New
- Bookmark
- Subscribe
- Mute
- Subscribe to RSS Feed
- Permalink
- Report Inappropriate Content
Hi Kishore,
Sorry not being able to give you a feedback regarding Con statement we were trying to achieve for better overlaying the two input raster grids I sent in my previous posts.
My boss put me in a rush for an urgent project that we have to deliver this week. This is why I have not had a chance to get back to you about my request.
I finally tested your "Con" statement and the result seems to match what we expected.
Thank you Kishore for your help.
Thank also all of you for pointing me out the syntax for Con statement. I really appreciated!
Best regards.
- Mark as New
- Bookmark
- Subscribe
- Mute
- Subscribe to RSS Feed
- Permalink
- Report Inappropriate Content
Hi, if I understand well, you are trying to adjust the superposition raster pixel values in order to show up the contamination for the cases you have contamination in one of two grids but when you do the sum of their contamination limit intervals values, it disappears. I guess, if you fix 85 (42+43) as a limit for a contamination class of the superposition grid, and you have values greater than 42 (image 2) and less than 43 (image 1), your superposition grid (image 3) will not show the contamination represented by the values greater than 42 of image 2 and the values less than 43 of image 1 because their sum is less than 85 (for example 45+30=75). I think your conditions are good, I don’t know why it doesn’t work.
- Mark as New
- Bookmark
- Subscribe
- Mute
- Subscribe to RSS Feed
- Permalink
- Report Inappropriate Content
- =IF(And(A1<=43; B1>=42; O1<=85);86;O1+B1)
- If (inRastA <= 43) (condition 1) and (inRastB> = 42) (condition2) and (inRastA+inRastB <= 85) (condition3), then the result is (ouRast = 86), otherwise (inRastA+inRastB).
There are 2 conditions in the first
There are 3 conditions in the second
Can you confirm the logic
Using the IF statement as the one that worked:
True = if A1<=43 AND B1 >42 and O1 (A1+B1 <=85) then 86
False = else A1 + B1
So the first checks should be
con 1 , con 2 , True_1&2, False_2, False_1
(A1+B1 < = 85), [ (A1<=43 and B1>=42), True, False], False)
(A1+B1 < = 85), [ (A1<=43 and B1>=42), 86, A1+B1], A1+B1)
(test 1,
True1 [ (test 2,
(True 1 and True 2), 86
True 1, False 2) A1 + B1
False 1 A1 + B1