- Home
- :
- All Communities
- :
- Products
- :
- ArcGIS Spatial Analyst
- :
- ArcGIS Spatial Analyst Questions
- :
- Re: calculate zonal histogram for each pixel in ra...
- Subscribe to RSS Feed
- Mark Topic as New
- Mark Topic as Read
- Float this Topic for Current User
- Bookmark
- Subscribe
- Mute
- Printer Friendly Page
calculate zonal histogram for each pixel in raster
- Mark as New
- Bookmark
- Subscribe
- Mute
- Subscribe to RSS Feed
- Permalink
- Report Inappropriate Content
Hello to everyone,
I am trying to create a habitat map based on a land cover map, and as it seems a big fish for me I prefer to ask for advice beforehand, and I thank very mcuh anyone who'd be willing to help !
I have a land use map at 15x15m with ~ 10 land uses, and a habitat classification based on land cover distribution around a point.
ex: Habitat "3" = Mosaic cropland (50-70%) / vegetation (grassland/shrubland/forest) (20-50%)
I would like to perform the following steps, for each pixel in the land use map:
1) get a pixel count of each of the land uses within a 150m radius
2) confront the land use distribution with my habitat classification directly in arcpy
3) attribute the habitat code value to the point, and later convert to raster.
And here are the points about which I'm wondering:
1) should I work in raster format and count pixels? or in shapefile format and calculate areas? I think raster.
2) should I implement a moving window, or convert each point in my shapefile to a 150m-wide circle? I don't even know whether zonal histogram would give me the correct result with that many overlapping features. (I've also thought of building several shapefiles of touching but not overlapping circles, but that's for later I think)
3) should I try and use multi-processing? I'm fairly new to Arcpy, so this might be tricky.
4) is it possible to confront tables in arcpy like in R or Matlab or should I export the distribution table to another software to run these calculations?
5) in a more general context, how to determine what is a reasonable amount of calculation? I have a sense 14 million iteration sounds stupidly high, but I couldn't get more precise...
Thanks in advance for any help!
Coline
- Mark as New
- Bookmark
- Subscribe
- Mute
- Subscribe to RSS Feed
- Permalink
- Report Inappropriate Content
Creating 14 million iterations is an option, but will be very slow and may fail. This thread (Re: Zonal statistics - percentiles ) shows how to loop through polygons, extract the raster, perform a statistic. But I do not recommend this method for your problem.
When you do a Focal Statistics using a Circle neighborhood with a size of 10 pixels you can determine the predominant (majority) landuse class, but this will not give you the second predominant class. see: ArcGIS Help (10.2, 10.2.1, and 10.2.2)
You could however create a raster per landuse class (set other landuses to NoData/Null). Use the Focal Statistics with the Circle and determine the count. Using the resulting raster it will be more easy to create an overlay and determine the landuse in the given neighborhood.
- Mark as New
- Bookmark
- Subscribe
- Mute
- Subscribe to RSS Feed
- Permalink
- Report Inappropriate Content
Hello,
Thank you for your quick answer and advice.
Iterating by land use class is a brilliant idea, thank you so much for this!
And I did not know about Focal Statistics, so this is a double win.
I don't know how long it will take to implement all this so I wanted to say thank you for now; if my final code is clean enough in the end I'll post it for further help to other users.
- Mark as New
- Bookmark
- Subscribe
- Mute
- Subscribe to RSS Feed
- Permalink
- Report Inappropriate Content
OK, good luck and please do post back and share with the community. If you have any problems in the process, just let me know.
Kind regards, Xander
- Mark as New
- Bookmark
- Subscribe
- Mute
- Subscribe to RSS Feed
- Permalink
- Report Inappropriate Content
Hello again!
So this is what I managed to write after 2 weeks of trial-and-error.
Basically, I learned Python by writing this script, so it must be really dirty but I tried my best, tried to clarify the process and pointed out the unsolved problems in the comments.
Now, I am currently running the last loop in order to retrieve 441 x 45 histogram tables...
Unfortunately Zonal Histogram will output a table with the 12 classes as rows and the 1,000 zones as columns, and I haven't the slightest idea of how to transpose and process these tables in python. I might do it in R.
Anyway, thanks for the help and counseling!
Coline
# set environment

import arcpy, os
from arcpy import env
from arcpy.sa import *
arcpy.CheckOutExtension("Spatial")
arcpy.env.snapRaster = "C:\\Users\\admin\\Desktop\\ArcGIS\\Inputs\\grid.img"
ws = "C:\\Users\\admin\\Desktop\\ArcGIS\\biodiversity\\window"
env.outputCoordinateSystem = arcpy.SpatialReference(2154)

#######################################################################################################################################

# Build an Index raster
# Here we build a raster of 15m-wide pixel covering the entire area and each pixel with unique value
# I found the trick either on this site or GISstackoverflow.. can't find it again.
# Something bugs at the Raster Calculator step so the script has to be run in two times, see line 28

perimeter = ws + "\\perimeter.shp"
base = arcpy.MinimumBoundingGeometry_management(contour, ws + "\\extent.shp", "ENVELOPE", "ALL", "Id")
base_raster = arcpy.PolygonToRaster_conversion(base, "FID", ws + "\\base.img", "CELL_CENTER", "NONE", 15)
base1 = Raster(base_raster)*0 + 1
flow1 = Int(FlowAccumulation(base1))
base64 = Raster(base_raster) * 0 + 64
flow64 = Int(FlowAccumulation(base64))
arcpy.BuildRasterAttributeTable_management(flow1, "Overwrite")
arcpy.BuildRasterAttributeTable_management(flow64, "Overwrite")

# The following lines cannot be copy-pasted in arcpy window directly after the others or a bug happens. Just do it in two steps
rastersum = Raster("flow1") * 10000 + Raster("flow64")
rasterid = arcpy.CopyRaster_management(rastersum, ws + "\\rasterID.img")

#######################################################################################################################################

# Build Fishnets
# Instead of coding a single moving window which would run 20 million times (> 2 years calculation time)
# I created fishnet-shapefiles of non-overlapping disks of radius 150m (~45,000 disks in one disk-fishnet)
# In order to get disks masks for all 15m pixels, and as a single disks covers a square of 21x21 pixel,
# 21x21 = 441 "disk-fishnets" area created, using pixels in the "origin.img" raster,
# In this raster you can find the 441 X origins and 441 corresponding pixels giving the Y-axis direction
#(used in the arcpy.CreateFishnet_management function)

# The loops correctly over ~3,000 iterations and then ArcGIS just shuts down.
# Is this a memory problem? I couldn't find a way to set proper names to temp files in the ExtractByMask functions,
# I think they pile up and ArcGIS runs out of memory.
# This is why I had to start the loop again at the point (line 64) where it had died. A pain.

# Also, I tried to parallelise the calculation by running ArcGIS in separate windows (works fine usually in ModelBuilder)
# But here it does not work, I think it comes from the ExtractByMask temp files which cannot be named
# and then conflict at some point, killing the run.
# I tried to set different arcpy.env.workspaces for each running ArcGIS window but failed at it.

origin = ws + "\\origin.csv"
fishnet = arcpy.TableToTable_conversion(origin, ws, "fishnet.dbf")

desc = arcpy.Describe(contour)
fishnet1 = arcpy.CreateFishnet_management("fishnet1.shp", str(desc.extent.lowerLeft), str(desc.extent.upperLeft), 315, 315, 2, 1, "# ", "NO_LABELS", "# ", "POLYGON")
origin_pg = arcpy.Select_analysis(fishnet1, ws + "\\origin_pg.shp","\"FID\" = 0")
yaxis_pg = arcpy.Select_analysis(fishnet1, ws + "\\yaxis_pg.shp","\"FID\" = 1")
extract = ExtractByMask(rasterID,origin_pg)
extract.save(ws + "\\origins.img")
extract2 = ExtractByMask(rasterID,yaxis_pg)
extract2.save(ws + "\\yaxis.img")

# Here is where the loop has to be re-started after ArcgiS goes down.

wst = "C:\\Users\\admin\\Desktop\\ArcGIS\\biodiversity\\table"
origins = ws + "\\origins.img"
extract4 = ExtractByAttributes(origins, "VALUE > 180002")
extract4.save (ws + "\\origins4.img")
origins4 = ws + "\\origins4.img"
contour = ws + "\\contour.shp"

arcpy.env.addOutputsToMap = False
cursor = arcpy.SearchCursor(origins4)
for row in cursor:
    print(str(row.getValue("Value")))
    X = ExtractByAttributes(ws + "\\origins.img", "Value = " + str(row.getValue("Value")))
    ptX = arcpy.RasterToPoint_conversion(X,"ptX.shp","Value")
    rX = arcpy.PointToRaster_conversion(ptX, "POINTID", ws + "\\temp","COUNT","POINTID",15)
    descX = arcpy.Describe(rX)
    Y = ExtractByAttributes(ws + "\\yaxis.img", "Value = 21 + " + str(row.getValue("Value")))
    ptY = arcpy.RasterToPoint_conversion(Y,"ptY.shp","Value")
    rY = arcpy.PointToRaster_conversion(ptY, "POINTID", ws + "\\temp","COUNT","POINTID",15)
    descY = arcpy.Describe(rY)
    fishnet = arcpy.CreateFishnet_management(ws + "\\fishnet1.shp", str(descX.extent.lowerLeft), str(descY.extent.lowerLeft), 315, 315, 300, 330, "# ", "NO_LABELS", "# ", "POLYGON")
    fishpoint = arcpy.FeatureToPoint_management(fishnet, ws + "\\fishpoint.shp")
    fishbuff = arcpy.Buffer_analysis(fishpoint, "fishbuff.shp", 150, "FULL", "ROUND")
    contour_lyr = arcpy.MakeFeatureLayer_management(contour, "contour_lyr")
    fishbuff_lyr = arcpy.MakeFeatureLayer_management(fishbuff, "fishbuff_lyr")
    arcpy.SelectLayerByLocation_management(fishbuff_lyr, "# ",contour_lyr)
    arcpy.FeatureClassToFeatureClass_conversion(fishbuff_lyr, wst, "zones" + str(row.getValue("Value")) + ".dbf")

#######################################################################################################################################

# Zonal histograms
# Here I try to extract the land cover distribution within each disk-mask
# Zonal histogram does not work for disks which have their centroids outside the value map
# (not to mention that they are useless) so I had to unselect them before.

# The tool won't run for more than 1,000 features at a time, to the disk-fishnets have to be split again
# It appears that it was a bug in arcgis 10.0, as stated in the following links, but normally they should have been solved in 10.3 - which I'm using.
# While reading the forum discussions about bugs in this tool, I learned that the tool used to write nonsense in the output tables.

# http://gis.stackexchange.com/questions/33502/zonal-histogram-fails-to-create-output-table-when-loopi...
# https://community.esri.com/thread/50764

# Does anyone know about this and could give some counsel about it?
# Some people bypassed the issue by doing Extract By mask instead of Zonal Histogram,
# But this would lead me back to a single moving window/disk, which is undoable.
# Or perhaps I could use a shapefile landcover and "Intersect" + "Calculate field area", but I doubt it would work well.

wsf = "C:\\Users\\admin\\Desktop\\ArcGIS\\biodiversity\\table2"
wsh = "C:\\Users\\admin\\Desktop\\ArcGIS\\biodiversity\\hist"
landcover = ws + "\\landcover.img"
contour = ws + "\\contour.shp"
env.workspace = wsf
list = arcpy.ListFeatureClasses("zone*")
for i in list:
    print(i)
    s = str(i)
    namei = s.split(".")[0]
    arcpy.CalculateField_management(i, "Id", '!FID!/1000', "PYTHON")
    arcpy.MakeFeatureLayer_management(i, "zone")
    arcpy.MakeFeatureLayer_management(contour, "contour")
    arcpy.SelectLayerByLocation_management("zone", "HAVE_THEIR_CENTER_IN", "contour")
    arcpy.CalculateField_management("zone", "BUFF_DIST", '0', "PYTHON")
    arcpy.SelectLayerByAttribute_management("zone", "CLEAR_SELECTION")
    for j in (0,1,2):
        print(j)
        mask = arcpy.Select_analysis(i, wsf + "\\mask.shp", "\"Id\" = " + str(j) + "AND \"BUFF_DIST\" = 0")
        # arcpy.MakeFeatureLayer_management(i, "masklyr", "\"Id\" = " + str(j) + "AND \"BUFF_DIST\" = 0")
        ZonalHistogram(mask, "FID", landcover, "hist_" + str(namei) + "_" + str(j) + ".dbf")
    Rlist = arcpy.ListRasters("t*")
    for k in Rlist:
        arcpy.Delete_management(k)
- Mark as New
- Bookmark
- Subscribe
- Mute
- Subscribe to RSS Feed
- Permalink
- Report Inappropriate Content
did you see the transpose fields tool
- Mark as New
- Bookmark
- Subscribe
- Mute
- Subscribe to RSS Feed
- Permalink
- Report Inappropriate Content
Hello and thank you for the suggestion!
Yes I saw that tool. But weirdly this isn't really a transpose tool, as it does not switch rows and columns but only converts everything in a 3-column matrix. Using that tool would allow me to convert the Zonal Histogram output table (10rows x 1000columns) into a ~5x1,000,000 table, but not to perform Zonal Histogram on more than 1,000 features at the time, so I did not retain that option.
Newsfeed: I launched the Zonal Histogram script last night and it ran over 5 feature classes only before collapsing (45 iterations per feature class). But ArcGIS did not collapse itslef so I got a clear error message: Error 999998 Not enough memory. I think I'm going nowhere without solving that memory problem.
So these are the options I am going to explore right now... any help will be greatly appreciated!
Try to handle the scratch.workspace thing, or the current.workspace. I never used it or understood how it works.
In ModelBuilder the intermediate data is automatically deleted but I couldn't find a tutorial of how to obtain that behaviour in arcpy.
Also, I read that one can run arcpy scripts directly in python without opening arcgis. This looks thrilling but I'll have to find out how to.
Thanks for reading and helping!
Coline
- Mark as New
- Bookmark
- Subscribe
- Mute
- Subscribe to RSS Feed
- Permalink
- Report Inappropriate Content
Hi Coline,
Good to see that you made progress. To bad that the process threw an memory error.
If a loop runs a number of times before it crashes, it may be due to the data used or in your case memory. To avoid this objects that are loaded into memery should be released. This can be done with the "del" statement. It doesn't delete the data (if stored on disk) but deletes the object from memory.
You can run the python code as stand alone (you do all the imports and check out the extension). There are many options, but an easy one could be PyScripter (32 bits). Many people use this simple free IDE to run and edit python code,
I will have a better look at the code later on, to see what enhancements could be made.
Kind regards, Xander
- Mark as New
- Bookmark
- Subscribe
- Mute
- Subscribe to RSS Feed
- Permalink
- Report Inappropriate Content
Question: what version of ArcGIS are you using? I see you use the "old" SearchCursor and not the one from the data access (da) module which became available in 10.1 SP1. One of the things I notice, is that you don't delete the row and cursor objects after the loop.
Some more observations and questions:
- I notice that you are using shapefiles and .img files. These are not the most optimal format for use in ArcMap. You may consider using featureclasses stored in a file geodatabase and read/write the rasters also to the file geodatabase (or use the Esri grid format).
- On line 19 you are referencing a variable called "contour". Where and how is this variable set?
- You import the os module. You might as well use it to reference data in their path like, fc = os.path.join(ws, fc_name).
- When writing the path, it may be easier to use the path obtained from the windows explorer and use the 'r' (raw) in front of it: like this: ws = r"C:\Users\admin\Desktop\ArcGIS\biodiversity\window"
- On line 68 you use where clause: "VALUE > 180002". What does the value 180002 stand for?
- When constructing a string, you may want to use the format method. for instance: "hist_" + str(namei) + "_" + str(j) + ".dbf" could be replaced by "hist_{0}_{1}.dbf".format(namei, j) where {0} is replaced by namei and {1} is replaced by j
If you are willing to share some of the date, it might be easier to derive what might be going wrong.
Kind regards, Xander
- Mark as New
- Bookmark
- Subscribe
- Mute
- Subscribe to RSS Feed
- Permalink
- Report Inappropriate Content
Hello everyone,
Time for a little feedback I think. First of all, thanks to both of you for the incredible help.
And more, thank you for the invaluable good practice tips, I had no idea of where to find such advice, still not but I'm keeping all you said in mind.
As for answering your questions quickly:
1) I am using arcgis 10.2.2 and had no idea there was a new cursor: I'll look at the correct version web help now.
2) The variable 'contour' is the shapefile "perimeter.shp" descibing the study area form, which I forgot to rename in the process of trying to make the code a bit clearer for posting.
5) "VALUE > 180002": this was the value at which the precedent run had crashed, so I extracted the points that remained to be processed before launching a new run. Dirty, but in 5-10 times I had them all. Still, I hope I'll learn enough to avoid that problem another time.
3), 4) and 6): thanks for the advice 
As I was really running out of time and courage, I have implemented the last part of the code in ModelBuilder, and I don't think I'll be able of doing it in Arcpy right now. So I'm posting the result in order for others to look at if they need ideas.
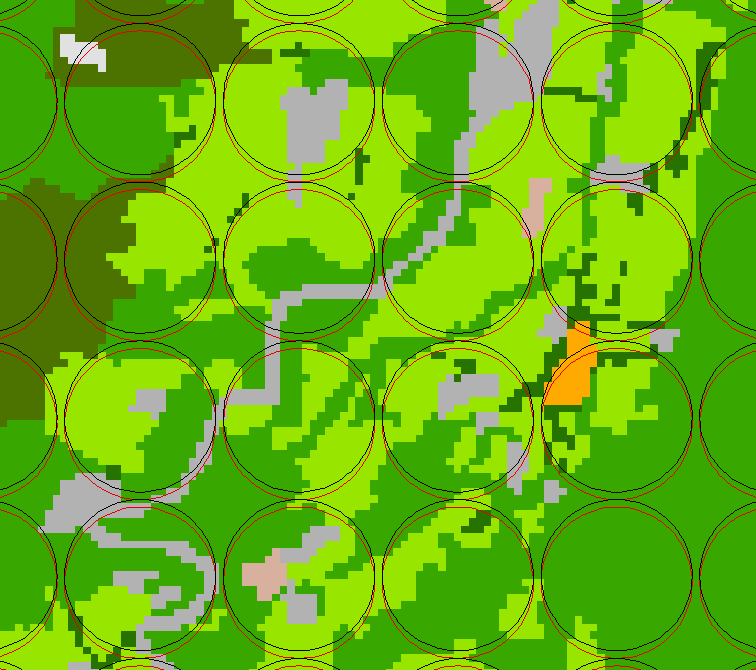
It aims at extracting the pixel distribution histogram for a great number of zones. In the picture below you can see how it works:
In the background the land cover map, resolution 15m x 15m: I wanted to extract the land cover in a 150m radius around each pixel.
For this I computed discs covering that area, and to go faster I made fishnets made of disks instead of single discs
As each disks covers an area of 21 x 21 = 441 pixels, and Zonal Histogram won't handle overlapping features, I had to make as many disk-fishnets to be able to cover the whole number of pixels. (two fishnets are shown in the picture)
All this runs in the arcpy code provided some patience and re-starting the code after crashes.
Then I could extract the land cover distribution for each disc-fishnet, in model builder using a double loop (i.e. two nested models).
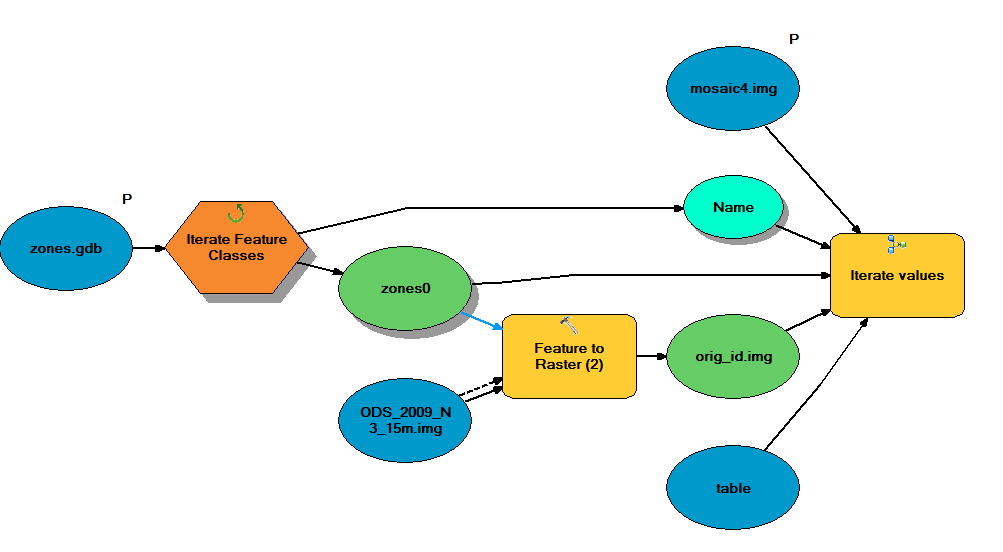
The 441 fishnet files are stored in the file zones.gdb. They have 3 relevant fields:
1) "orig_id" gives a unique value for each disk in order to delimit the zones for the "Zonal histogram" tool.
2) "Id2" = Int(FID/1000) +1 allows to group disks in 46 lots of 1,000.
3) A third field of 0 and 1 allowed to filter out disks which have their centers outside the land cover raster
The model has basically 3 steps:
4) Main model: for each feature class (fishnet), I convert the unique-value-per-disk field, "orig_id", to raster.
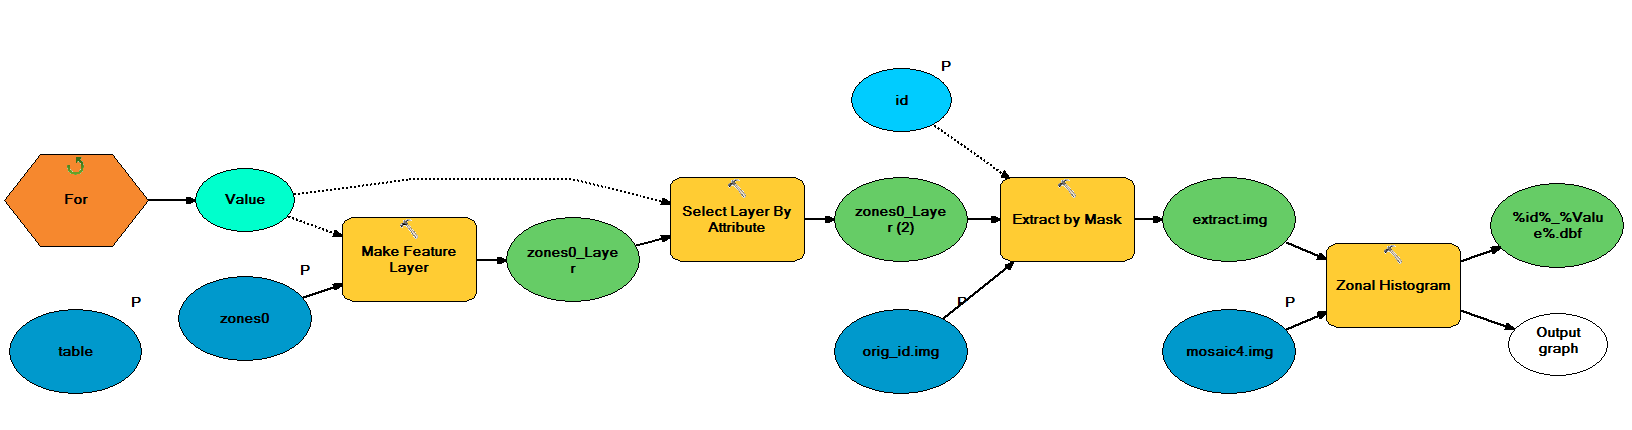
5) Nested model: another loop extracts a fragment of this raster by groups of 1,000 using the ID2 field. For each value of Id2, I make a feature layer of only the features with Id2 = for-loop- increment*, and extract the fragment from the whole fishnet fishnet with "extract by attributes".
6) Nested model: each fragment of orig_id.img is used as a zone field for zonal histogram.
Main loop:
Nested loop:
Here are the main problems I encountered and the work arounds I found:
2) Zonal histogram won't run over more than 1,000 features at a time, so I needed to split the job. the "+1" is because in the nested model, which is a for loop, iteration over the value 0 always fails, (Error message: "the precondition is false" and then in the downloop steps "the inputs are not current") so I looped over 0:47 instead of 0:46 and the loop bug in 0 does not count anymore.
3) if you leave them the Zonal Histogram tool crashes completely.
4) Back when I was trying arcpy and using feature classes as zone input for Zonal Histogram, it would automatically convert them to raster and automatically name them, with no workaround. They piled up in the workspace and made the loop eventually crash. By converting the fragment to raster this is avoided.
5) "Zonal histogram" will ignore an output of "select layer by attributes", so "extract" is compulsory. Also, the SQL query within "make feature layer" does not work so I had to use both this and "select layer by attributes".
All in all, the loop takes 1 hour to loop over 1 fishnet. Limiting steps are 'extract by mask' (15s) and 'zonal histogram' (1mn10s). The expected calculation time for the 441 fishnets will be 18 days, but with parallelisation in 10 simultaneous runs this can be brought down to 2 days.
And this is better than the 2 years with which I started I just hope the loop will be stable over 40 feature classes.