- Home
- :
- All Communities
- :
- Developers
- :
- Native Maps SDKs
- :
- Qt Maps SDK Questions
- :
- How to manage distance between symbols and labels ...
- Subscribe to RSS Feed
- Mark Topic as New
- Mark Topic as Read
- Float this Topic for Current User
- Bookmark
- Subscribe
- Mute
- Printer Friendly Page
How to manage distance between symbols and labels on zoom in and zoom out in arcgis 100.6?
- Mark as New
- Bookmark
- Subscribe
- Mute
- Subscribe to RSS Feed
- Permalink
- Report Inappropriate Content
Hi,
I am using arcgis 100.6 and qt 5.12.1 for application development.
I want to display some text information alongside my symbol(S1) . I have tried 2 methods to do the same and facing issues in both.
1. Using TextSymbol class
2. Using labelDefinitions() function of LabelDefinitionListModel class
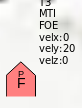
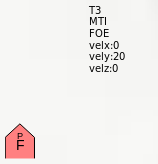
1. Using TextSymbol class: When using TextSymbol to display the data, I first assigned same coordinates as the symbol(S1) to the textSymbol (TS) . Both the symbols overlap as expected
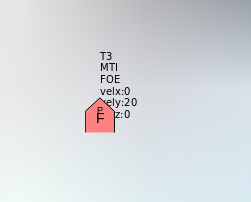
To avoid the overlap I set the geometry of the TextSymbol with some offset as follows:
TS->setGeometry(Point(S1.y + 0.01, S1.x + 0.01, 4326));However I am observing that the distance between both symbols changes when zoomed in or out. Below are images for S1 and TS with same offset (0.01) but different zoom in scales. The distance between S1 and TS increases as I zoom in more. Is there a way to avoid this??
===========================================================================================
2. Using labelDefinitions() function of LabelDefinitionListModel class: The second way I used was using labelDefinitions(). Here the distance between the symbol (S1) and label (L1) remains constant on zoom in zoom out but the placement of L1 is far from the S1. I tried different labelPlacement options available in labelDefinitions() but all seem to display approximately the same distance.
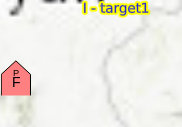
The labeldefinitions() uses the following json string:
QString mapcode::createLabelJsonName() const
{
return QString(QStringLiteral("{\"labelExpressionInfo\":{\"expression\":\"'I - ' + $feature.NAME\"},"
"\"labelPlacement\":\"esriServerPointBelowCenter\","
"\"where\":\"NAME <> ' '\","
"\"allowOverlapOflabel\":\"avoid\","
"\"allowOverlapOfFeatureBoundary\":\"avoid\","
"\"maxScale\":\"0\",\"minScale\":\"0\","
"\"symbol\": {\"angle\":0,\"backgroundColor\":[0,0,0,0],"
"\"borderLineColor\":[0,0,0,0],"
"\"borderLineSize\":0,\"color\":[0,0,255,255],"
"\"font\": {\"decoration\":\"none\",\"size\":10,"
"\"style\":\"normal\",\"weight\":\"normal\"},"
"\"haloColor\":[255,255,0,255],\"haloSize\":1.5,"
"\"horizontalAlignment\":\"center\",\"kerning\":false,"
"\"type\":\"esriTS\",\"verticalAlignment\":\"middle\",\"xoffset\":0,\"yoffset\":0}}"));
}
I want L1 to be placed directly above or below S1. Is there a way to acheive this using labels??
Solved! Go to Solution.
Accepted Solutions
- Mark as New
- Bookmark
- Subscribe
- Mute
- Subscribe to RSS Feed
- Permalink
- Report Inappropriate Content
For the first workflow, I think the problem is that as you zoom in, the added .01 will have a larger effect. The better solution would be to use the exact same geometry as the red symbol, but then adding X and Y offset to the TextSymbol - MarkerSymbol Class | ArcGIS for Developers