- Home
- :
- All Communities
- :
- Developers
- :
- Native Maps SDKs
- :
- Qt Maps SDK Questions
- :
- About achieve contours issues through existing .sh...
- Subscribe to RSS Feed
- Mark Topic as New
- Mark Topic as Read
- Float this Topic for Current User
- Bookmark
- Subscribe
- Mute
- Printer Friendly Page
About achieve contours issues through existing .shp file or .tpk file
- Mark as New
- Bookmark
- Subscribe
- Mute
- Subscribe to RSS Feed
- Permalink
- Report Inappropriate Content

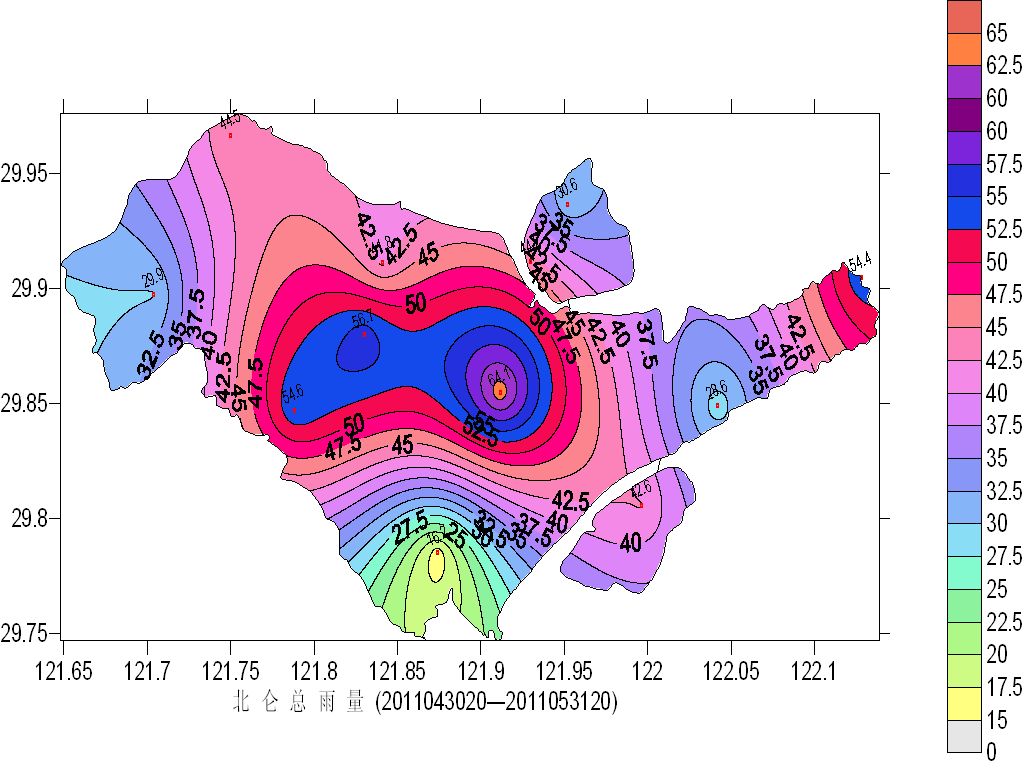
Hi, I was a novice.Recently, I am thinking to use the existing map file to generate contours, such as a .shp file and .tpk file,then to fill contours in different colors.The idea is mainly used to study the source of diffuse gas in the air, the gas will be spread around over time, density will decrease with increasing distance. I know that (x, y, density) data, but I do not know how to generate the two-dimensional contour on density.Could you help me find an effective way to do this using arcgis runtime sdk for qt .Thank you very much .
Solved! Go to Solution.
Accepted Solutions
- Mark as New
- Bookmark
- Subscribe
- Mute
- Subscribe to RSS Feed
- Permalink
- Report Inappropriate Content
I think you may need to create a GP Package/Service from a GP Model or Python script in ArcGIS Desktop. This sounds like something you will likely need the Spatial Analyst extension for. To do this, you could use either Local Server or ArcGIS Server, and consume the service in your application using the Geoprocessor. Note that this workflow would only work with the C++ API (on Windows and Linux), as the QML API does not yet have Geoprocessor implemented.
As far the actual script, you may need to string a few tools together. You could consider converting your x,y,density data (I assume these are points) to raster (Point to Raster—Help | ArcGIS for Desktop ). Then, feed the raster into Contour Spatial Analyst tool (Contour—Help | ArcGIS for Desktop ). From that, you could return a Feature Set to Qt, and displaying those features on the map. You could then do all of the symbology with the Qt SDK, using something like the Class Breaks Renderer.
I hope this helps. As I'm not familiar with your data, it is hard to say if this is exactly what you need, but hopefully it can get you on the right track. Neither the C++ nor the QML API have spatial analyst functions built within it, so the GP Service route is what most people need to do for these types of workflows.
Thanks!
Luke