Turn on suggestions
Auto-suggest helps you quickly narrow down your search results by suggesting possible matches as you type.
Cancel
- Home
- :
- All Communities
- :
- Products
- :
- ArcGIS Pro
- :
- ArcGIS Pro Questions
- :
- Is it possible to customize x-axis labels in line ...
Options
- Subscribe to RSS Feed
- Mark Topic as New
- Mark Topic as Read
- Float this Topic for Current User
- Bookmark
- Subscribe
- Mute
- Printer Friendly Page
Is it possible to customize x-axis labels in line chart?
Subscribe
408
0
09-29-2020 09:09 AM
09-29-2020
09:09 AM
- Mark as New
- Bookmark
- Subscribe
- Mute
- Subscribe to RSS Feed
- Permalink
- Report Inappropriate Content
Hello,
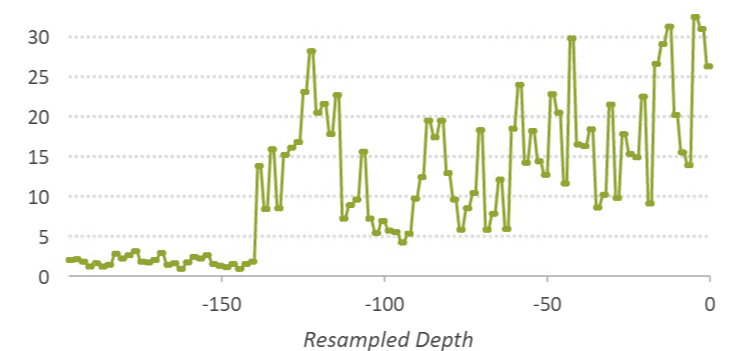
I am wondering if it's possible to customize the interval of numbers showing along x-axis. For example, for line chart below, the current interval is 50 and x-axis displays -150, -100, -50, 0. However, I want to customize the interval to 10, so the x-axis displays: -190, -180, -170, -160, -150, ......, -100, -90, ......, - 50, -40, ......, 0. Is this possible? Thank you.
0 Replies