- Home
- :
- All Communities
- :
- Products
- :
- ArcGIS Pro
- :
- ArcGIS Pro Questions
- :
- Is it possible for a Related Table to be Symbolize...
- Subscribe to RSS Feed
- Mark Topic as New
- Mark Topic as Read
- Float this Topic for Current User
- Bookmark
- Subscribe
- Mute
- Printer Friendly Page
Is it possible for a Related Table to be Symbolized?
- Mark as New
- Bookmark
- Subscribe
- Mute
- Subscribe to RSS Feed
- Permalink
- Report Inappropriate Content
Hello, I have a feature attribute table (82) which i related as 1:M relationship to an excel sheet(74,000). The reason for the relationship is because when i joined, i have over 3,000k information missing. But when i relate the tables no issues, so now I am trying to symbolise the the quantity field which is in the excel sheet on the feature polygon but it is proving difficult as the symbology field does not show the quantity field from the excel sheet that will be symbolized on the shapefile. What could be the solution to this? is it possible at all to symbolize a related database where the field that will be symbolize is in the excel sheet not the feature attribute table? Thank you for your quick response.
- Mark as New
- Bookmark
- Subscribe
- Mute
- Subscribe to RSS Feed
- Permalink
- Report Inappropriate Content
Hi Ayokunle Adebisi ,
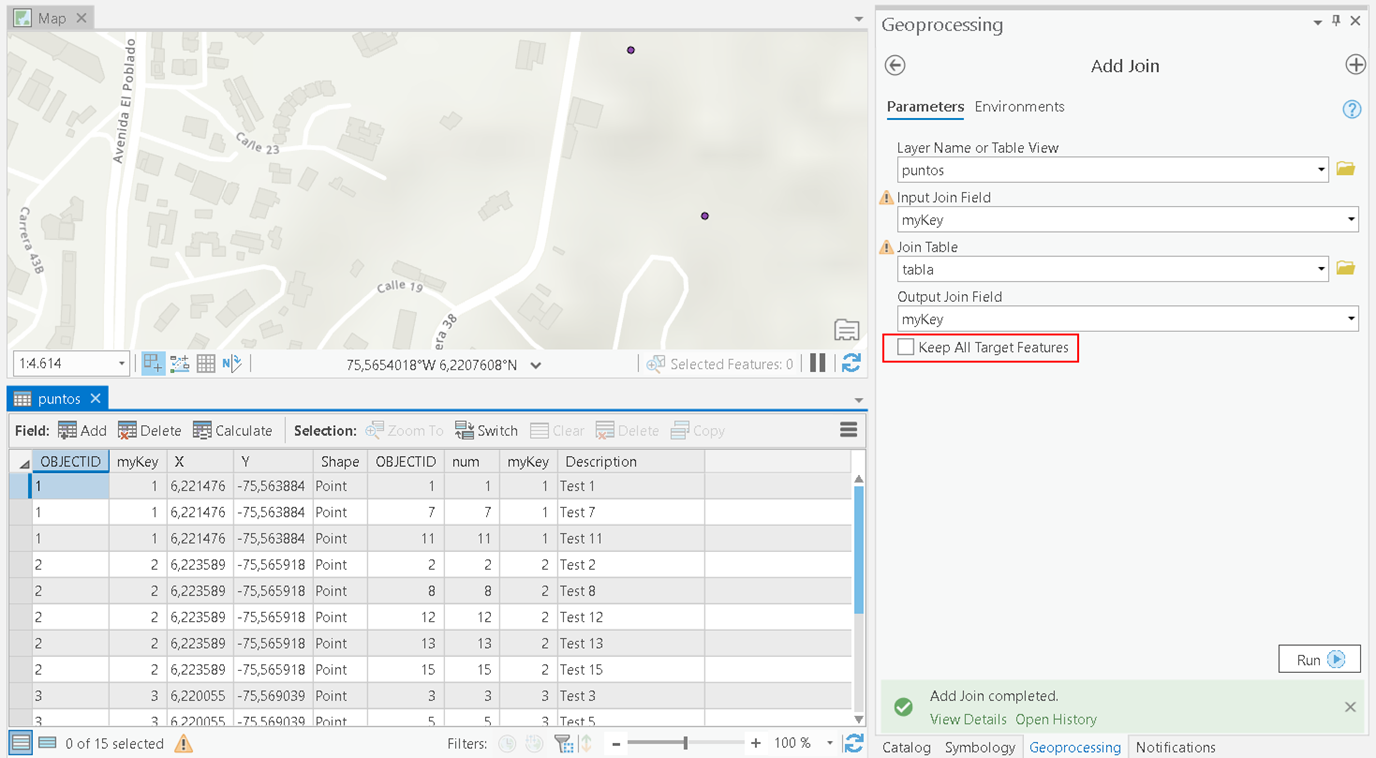
You mention that you have a quantity field in the related table that you want to visualize. Your cardinality is 1:m. Do you want to visualize every individual quantity value for each feature? That will be difficult, because the features will overlap. You can join the related information to the features and when you switch off the option "Keep All Target Features" the features will duplicate and produce a feature for each related record:
Normally, you will want to run some statistics to visualize the average, max or min value or perhaps the most recent. This can be done using for instance Arcade, however it will need to be done in a field calculation, since the symbology profile does not allow you to access the related table.
- Mark as New
- Bookmark
- Subscribe
- Mute
- Subscribe to RSS Feed
- Permalink
- Report Inappropriate Content
Thanks for your response.. you mean I should join the feature with the related table of feature&excel sheet. Yes actually joining directly duplicate the feature.. is it ok to be duplicated?.
- Mark as New
- Bookmark
- Subscribe
- Mute
- Subscribe to RSS Feed
- Permalink
- Report Inappropriate Content
Hi Ayokunle Adebisi ,
In many cases this is not recommended. When you have all these duplicated features that sit on top of each other, how do you think the visualization will look like? Not very pretty... or understandable in most cases.
That is why normally you would perform some analysis on the records related to a feature to determine the single value to visualize. What would you like to visualize based on your data?
- Mark as New
- Bookmark
- Subscribe
- Mute
- Subscribe to RSS Feed
- Permalink
- Report Inappropriate Content
I will perform some analysis using model builder on the records joined to a feature to determine the single value to visualize, though it is duplicated. Performing such analysis remove a single value to visualize her data.
- Mark as New
- Bookmark
- Subscribe
- Mute
- Subscribe to RSS Feed
- Permalink
- Report Inappropriate Content
- Mark as New
- Bookmark
- Subscribe
- Mute
- Subscribe to RSS Feed
- Permalink
- Report Inappropriate Content
Thanks @Andres Castillo, please can I work through the documentation with you tomorrow 24/01/2020, anytime you are free. Thanks