- Home
- :
- All Communities
- :
- Products
- :
- ArcGIS Pro
- :
- ArcGIS Pro Questions
- :
- ArcGIS Pro 2.5: How to display the original reclas...
- Subscribe to RSS Feed
- Mark Topic as New
- Mark Topic as Read
- Float this Topic for Current User
- Bookmark
- Subscribe
- Mute
- Printer Friendly Page
ArcGIS Pro 2.5: How to display the original reclassified values (start and end) along with the new?
- Mark as New
- Bookmark
- Subscribe
- Mute
- Subscribe to RSS Feed
- Permalink
ArcGIS Pro 2.5: How to display the original reclassified values (start and end) along with the new?
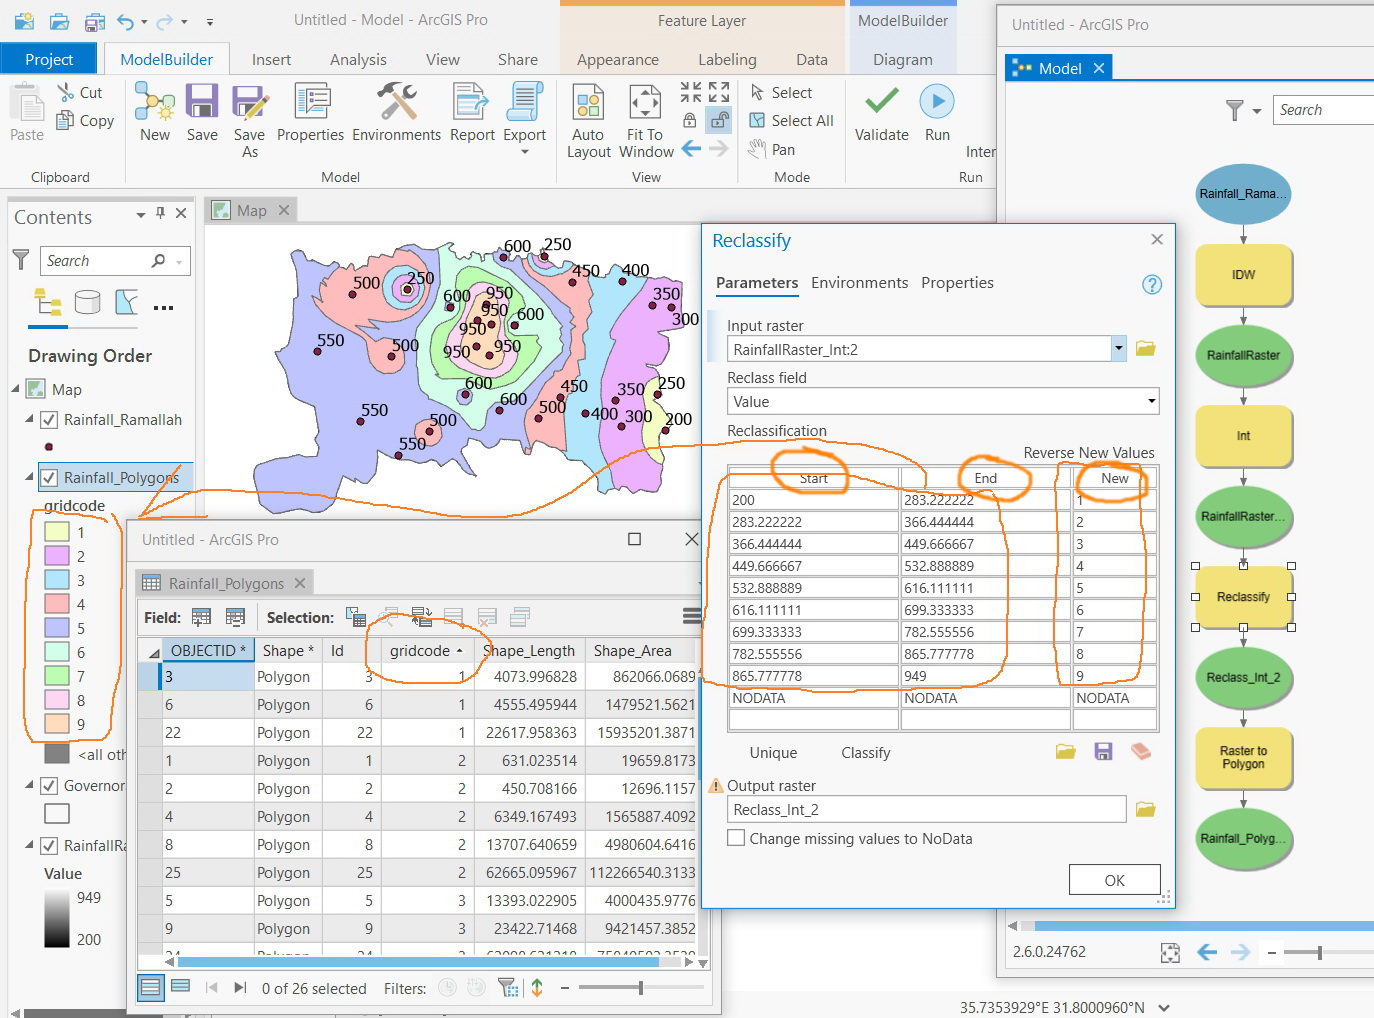
I couldn’t figure out how to display the original reclassified values (start and end) along with the new. This sort of presentation is quite essential as it reminds us what the values (1, 2,…,9) means
In addition to that, I’m not sure how these original reclassified values (start and end) can be linked to the polygon layer that is derived from the reclassify raster?

Jamal Numan
Geomolg Geoportal for Spatial Information
Ramallah, West Bank, Palestine
- Mark as New
- Bookmark
- Subscribe
- Mute
- Subscribe to RSS Feed
- Permalink
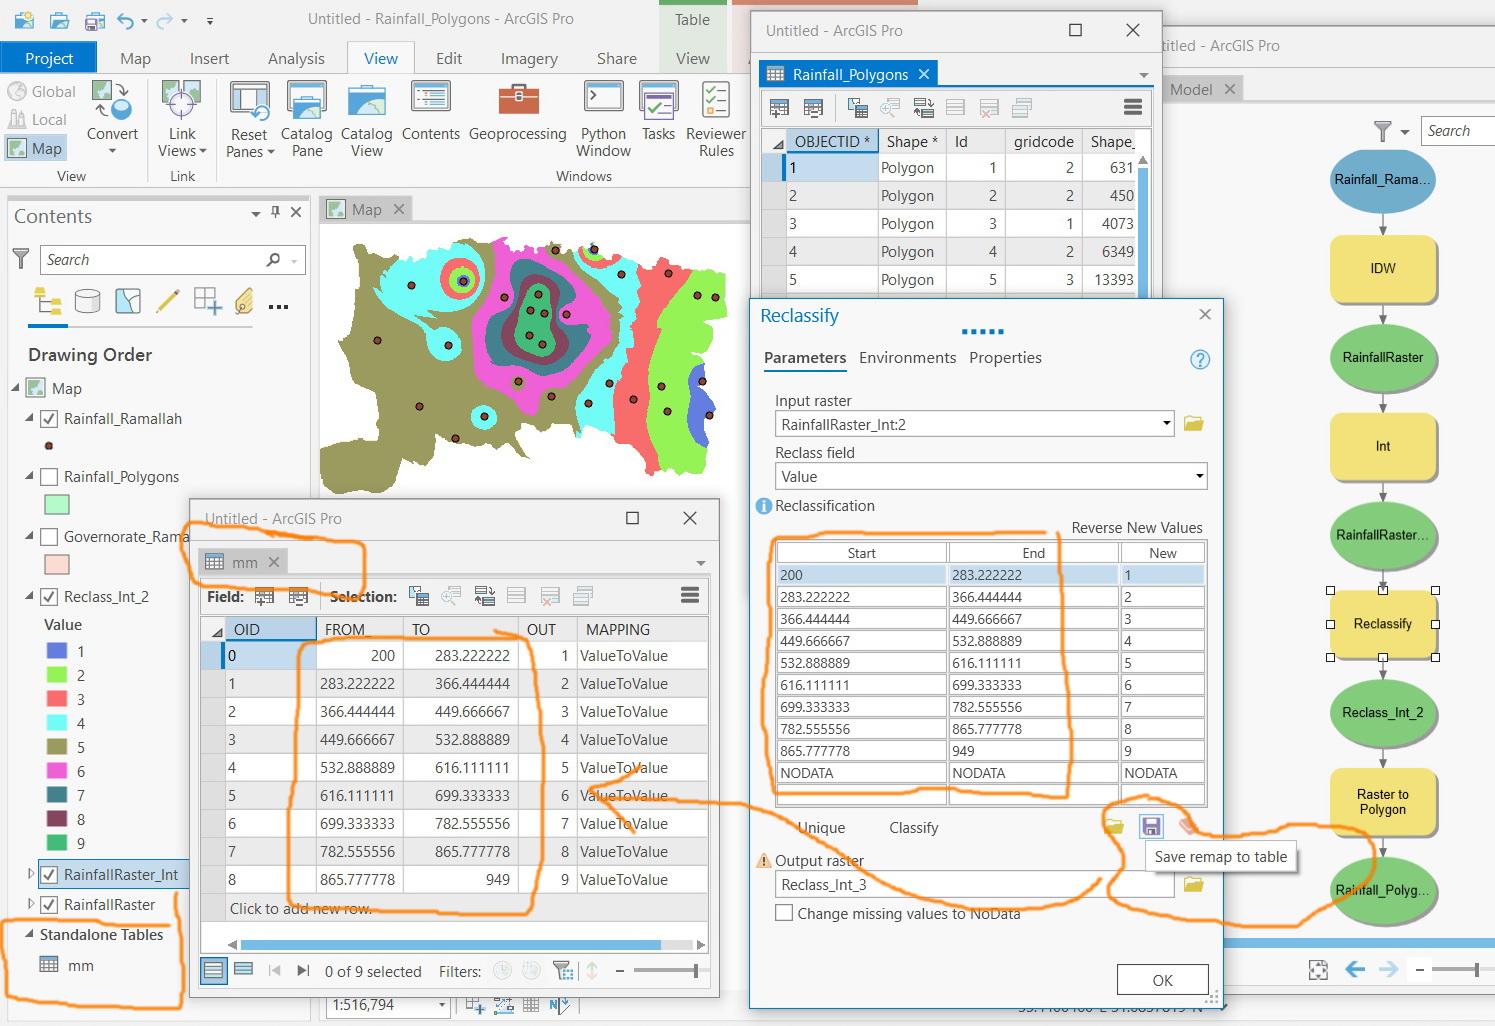
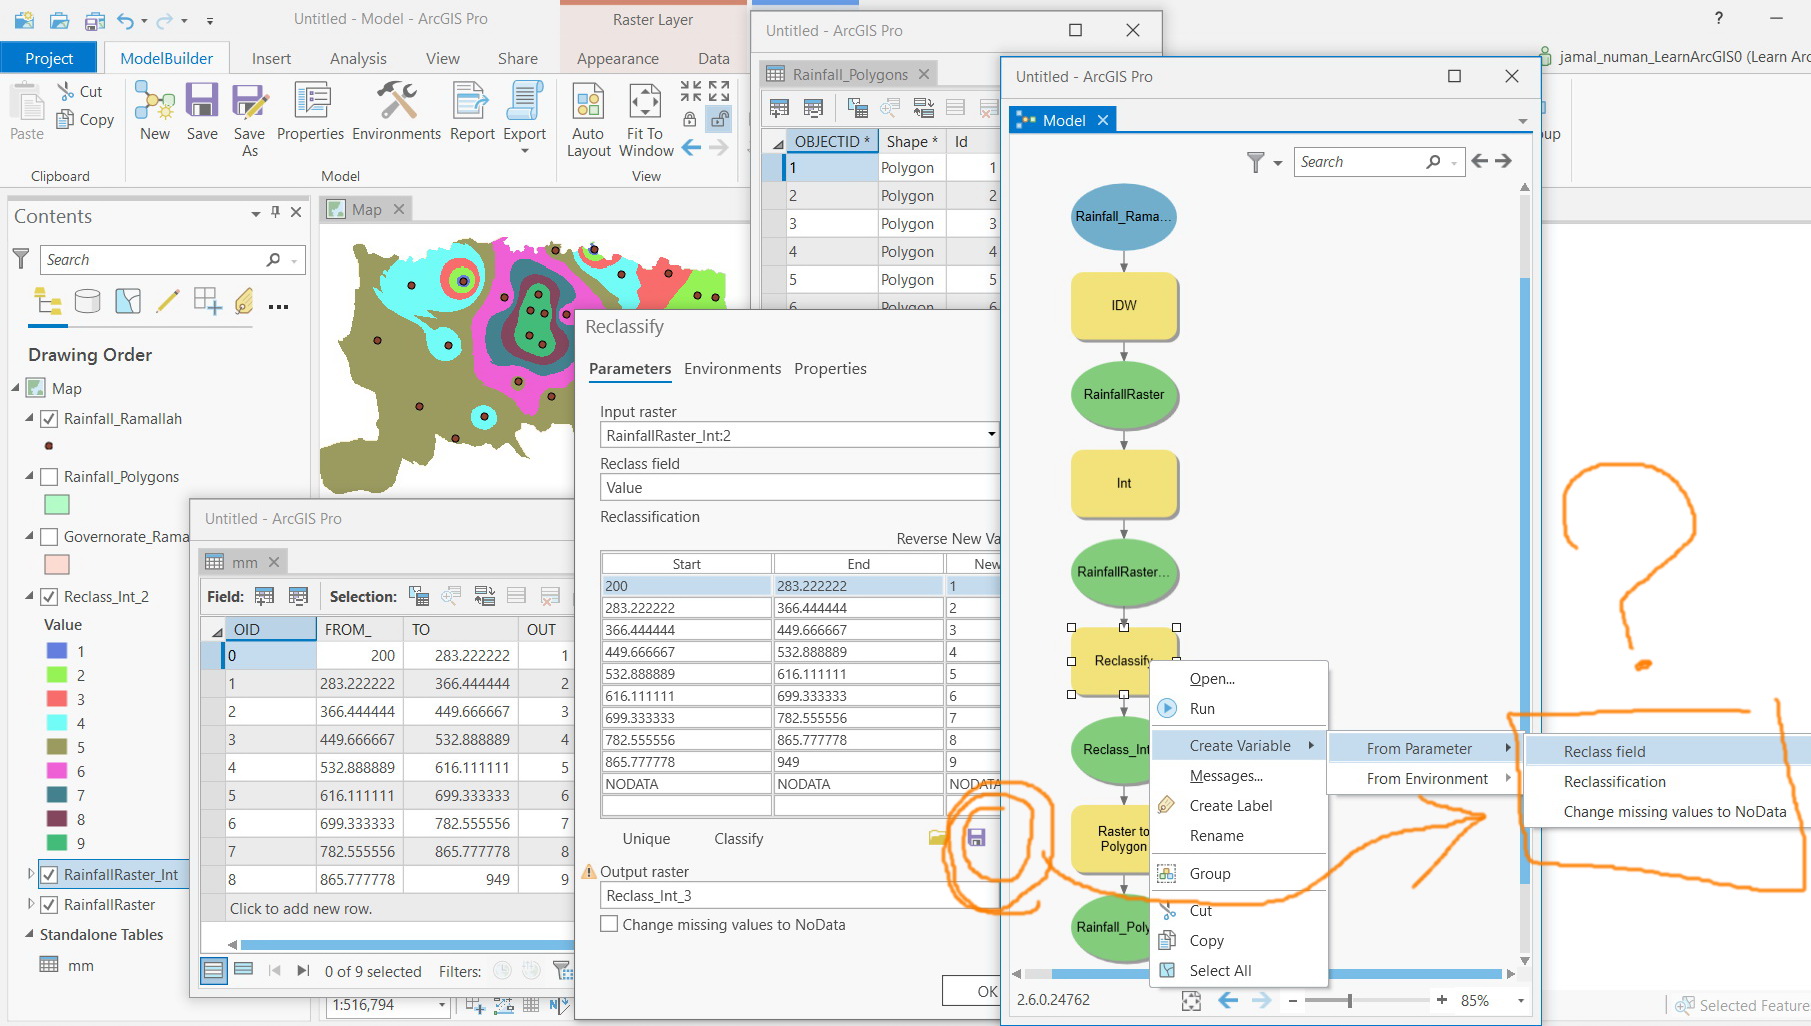
Jamal - to your first question about displaying Start-End Values in the Map View Contents Pane, I don't think this is possible with the GP tool. BUT you can click the SAVE button below the NODATA line to save the column and values to a remap table. Then you can add the remap table to your Map View and use that in your Layout legend once you convert the legend and table to graphics. I haven't fine tuned my legend nor layout but you get the idea.
- Mark as New
- Bookmark
- Subscribe
- Mute
- Subscribe to RSS Feed
- Permalink
Many thanks Robert for the help.
Nice workaround. However, I’ll be posting two ideas for this to have much more integrated piece of work


Jamal Numan
Geomolg Geoportal for Spatial Information
Ramallah, West Bank, Palestine
- Mark as New
- Bookmark
- Subscribe
- Mute
- Subscribe to RSS Feed
- Permalink
Two ideas are posted
Jamal Numan
Geomolg Geoportal for Spatial Information
Ramallah, West Bank, Palestine