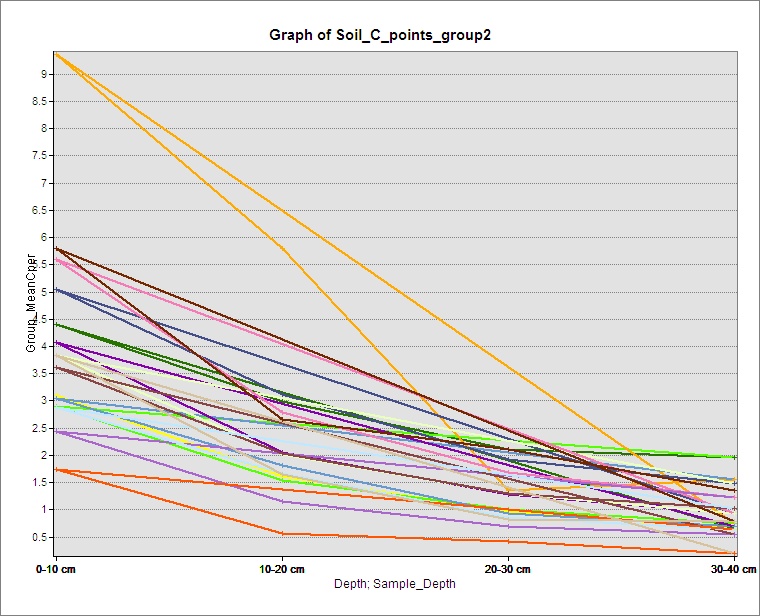
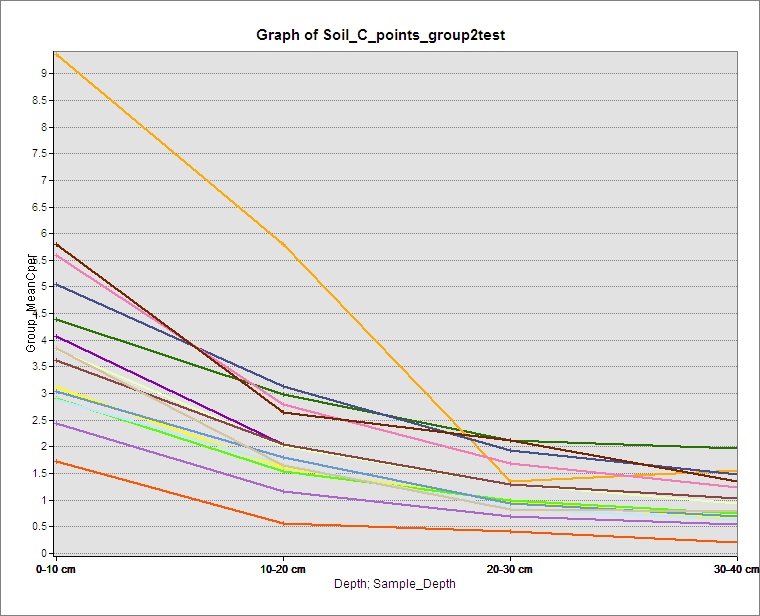
when trying to produce a line graph that showed how soil carbon changed through the soil profile from 0-10cm to10-20cm to 20-30cm and 30-40cm the graph also drew a line connecting 0-10cm with 30-40cm.

The ideal improvement would be for the graph not to complete the circle in the data or for that to be optional.
or to be able to change the lines to "no color"
how I was able to work around the issue was add a record for each sample with a null value which had to be in order inthe Object ID soit was easier to do this as a table then import as and event theme and then in the graph advanced properties in the data menu "make null points" of all those values
