- Home
- :
- All Communities
- :
- Products
- :
- ArcGIS Pro
- :
- ArcGIS Pro Blog
- :
- Processing of Sentinel-5P data within the ArcGIS p...
Processing of Sentinel-5P data within the ArcGIS platform: Creating nitrogen dioxide time series in R and ArcGIS
- Subscribe to RSS Feed
- Mark as New
- Mark as Read
- Bookmark
- Subscribe
- Printer Friendly Page
- Report Inappropriate Content
Sentinel-5P is a satellite that is operating within ESA's Copernicus program since 2017. The goal of the mission is a very dense scheduled operational monitoring of the atmosphere. Using the TROPOMI instrument on board, various parameters are measured, such as tropospheric pollutants, greenhouse gases, aerosols, and cloud cover. NO2 concentrations are also provided as a separate product, which can be downloaded as NetCDF. More information about this product can be found in the ESA user manual.

Figure 1: Data structure of the Sentinel 5P products
How can NO2 concentrations of the atmosphere be displayed in ArcGIS Pro and how can a time series be created?
This article answers these and other questions about the download and use of remote sensing data in R and ArcGIS Pro.
The analysis consists of two parts: The first part contains the data acquisition and data processing in R, the second the representation and visualization within ModelBuilder (Python) in ArcGIS Pro. Thereby the focus is on automation.
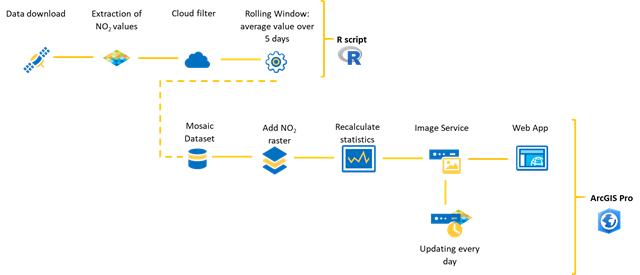
Figure 2: Workflow to create an automated time series analysis based on Sentinel-5P data
The figure above shows the schematic workflow where an R script is used to download Sentinel-5P data from the Copernicus-Hub, extract the corresponding NO2 product variable and export the scenes (filtered and clipped) as GeoTiff.
Afterwards a mosaic dataset is created in ArcGIS Pro, which contains the resulting NO2 GeoTiff files. The Mosaic can be published as Image Service.
R script
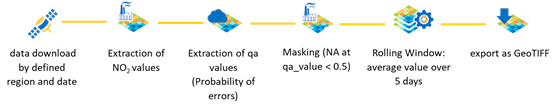
Figure 3: Workflow R script
With the help of the R package GetSpatialData various satellite data available on the Copernicus Open Access Hub can be downloaded automatically. Conditions like recording period, satellite, product type and area of interest can be defined. NO2 data is stored in the Sentinel-5P product type L2__NO2___, therefore only this data is of interest and should be downloaded for the desired period.
The subsequently downloaded NetCDF files contain several variables, such as longitude and latitude, different viewing angels and various nitrogen dioxide related variables. Product variable 6 (nitrogendioxide_tropospheric_column) displays the NO2 concentration in the troposphere, which is used for the following analysis. Using the S5Processor package, this variable can be queried and saved as GeoTiff. In addition, cloud masking is applied to prevent outliers. Product variable qa_value indicates the error probability of the measured values (e.g. due to cloud cover or snow). By blending the two variables and the resulting elimination of errors (qa_value < 0.5 = NoData) a corrected nitrogen dioxide layer is obtained (unit molecules/cm²).
Why does it make sense to calculate average values per pixel over five or more days?
The averaging of NO2 concentrations over a 5-day period eliminates different effects:
- NoData values due to clouds (masked by qa-variable)
- NoData values due to incorrect overlap areas of the satellite scenes (masked by qa variable)
- Wind influencing NO2 drifts in or from neighboring areas
When exporting the NO2 values as GeoTiff it is important to save the date of the scene or rolling window as part of the name.
ArcGIS Pro

Figure 4: Workflow ModelBuilder (export as Python script)
After all data has been transformed and edited, the workflow is continued in ArcGIS Pro.
ArcGIS Pro makes it easy to create an automated workflow within the ModelBuilder that performs spatial analysis using the appropriate geoprocessing tools.
In this case a mosaic dataset is created and enriched daily with the newly exported NO2 GeoTiff files. The fact that the raster data is dated means that it can automatically be arranged chronologically. With latest addition to ArcGIS Pro (2.5 and later) this Mosaic can be declared a Multidimensional dataset and thus allow the Multidimensional tools (aggregation, change detection, trending, etc.) to be applied.
The mosaic dataset can also be published as an image service using ArcGIS Server.
Once the scripts are set up, they can be run automatically every day, for example, using the Windows Task Scheduler.
But how are the result layers supposed to be interpreted?
This article focuses on the technology used and not on the scientific interpretation of the results. Nevertheless:
- Values provide information about NO2 concentrations in the troposphere (up to 15 km above the earth's surface), but not at a specific location near the ground (e.g. a busy road)
- NO2 concentrations are based on different influencing factors: Winds influence the airflow of NO2 from or in neighboring countries; cloud cover falsifies measured values and must be masked; low temperatures prevent the air masses from rising and thus also the rise of NO2; thunderstorms: lightning as a source of nitrogen oxides
- Averaging over a certain period bypasses NoData values and eliminates meteorological effects that occur selectively
A detailed StoryMap of Esri Germany with illustrations and the Sentinel-5P image service can be found here (only in German).
The R script can be downloaded on GitHub. Günter Dörffel of Esri Global Inc. has integrated the steps of this workflow in a toolbox using R Bridge and native arcpy. The toolbox does not do the data aggregation but relies on the ArcGIS Pro capabilities of flexible aggregation (for days, weeks, months, …) through the Multidimensional Toolset in ArcGIS Pro. The toolbox and its scripts are also available via the link.
To make sure both the R script and the toolbox run without problems, the following packages must be installed previously in R: devtools, getSpatialData, raster, sf, sp, dismo, geosphere, rgeos, S5Processor, ncdf4, ggplot2, maptools, rgdal, lubridate, cat. For the toolbox, a working version of the R-bridge needs to be available.
You must be a registered user to add a comment. If you've already registered, sign in. Otherwise, register and sign in.