- Home
- :
- All Communities
- :
- Products
- :
- ArcGIS Online
- :
- ArcGIS Online Questions
- :
- How to customize tile layer's legend symbology in ...
- Subscribe to RSS Feed
- Mark Topic as New
- Mark Topic as Read
- Float this Topic for Current User
- Bookmark
- Subscribe
- Mute
- Printer Friendly Page
How to customize tile layer's legend symbology in ArcGIS Online?
- Mark as New
- Bookmark
- Subscribe
- Mute
- Subscribe to RSS Feed
- Permalink
- Report Inappropriate Content
I am using a tile layer of Land Surface Temperature in a Web App in ArcGIS Online. The tile came with its original stretch symbology from blue (cooler) to red (hotter), and both ends of the stretch bar were labelled accordingly.
After publishing and including the tile in a Web App, In both the Layer List and Legend widgets, the following is displayed:
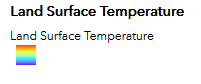
Ideally, I would like to add text labels next to the top and bottom portions of the color bar to indicate what the color scale represents. I have been looking at JavaScript API examples but haven't seen an example of this particular case yet. My questions are:
1. Is this possible to achieve with JS API?
2. If not, is there another way to do this?
Thanks in advance for any ideas!
- Mark as New
- Bookmark
- Subscribe
- Mute
- Subscribe to RSS Feed
- Permalink
- Report Inappropriate Content
Hi Byron, quick question. Did you ever resolve this issue? I´d like to do something similar. Take the tile layer legend and try to make it a little more cartographically pleasing so to speak. Many thanks, Dan.
- Mark as New
- Bookmark
- Subscribe
- Mute
- Subscribe to RSS Feed
- Permalink
- Report Inappropriate Content
I would like to add text to the min and max of the continuous colour legend for a tile layer. When configuring symbology in ArcGIS Pro the label text I provide for min and max values are displayed in AGOL as "label1 - lable2" in line with the middle of the colour bar.