- Home
- :
- All Communities
- :
- Products
- :
- ArcGIS Online
- :
- ArcGIS Online Questions
- :
- Re: Can't create a choropleth map - just get the p...
- Subscribe to RSS Feed
- Mark Topic as New
- Mark Topic as Read
- Float this Topic for Current User
- Bookmark
- Subscribe
- Mute
- Printer Friendly Page
Can't create a choropleth map - just get the points - why?
- Mark as New
- Bookmark
- Subscribe
- Mute
- Subscribe to RSS Feed
- Permalink
Howdy! 😁 I'm new to GIS, been taking this specialization course on Coursera for a while now.
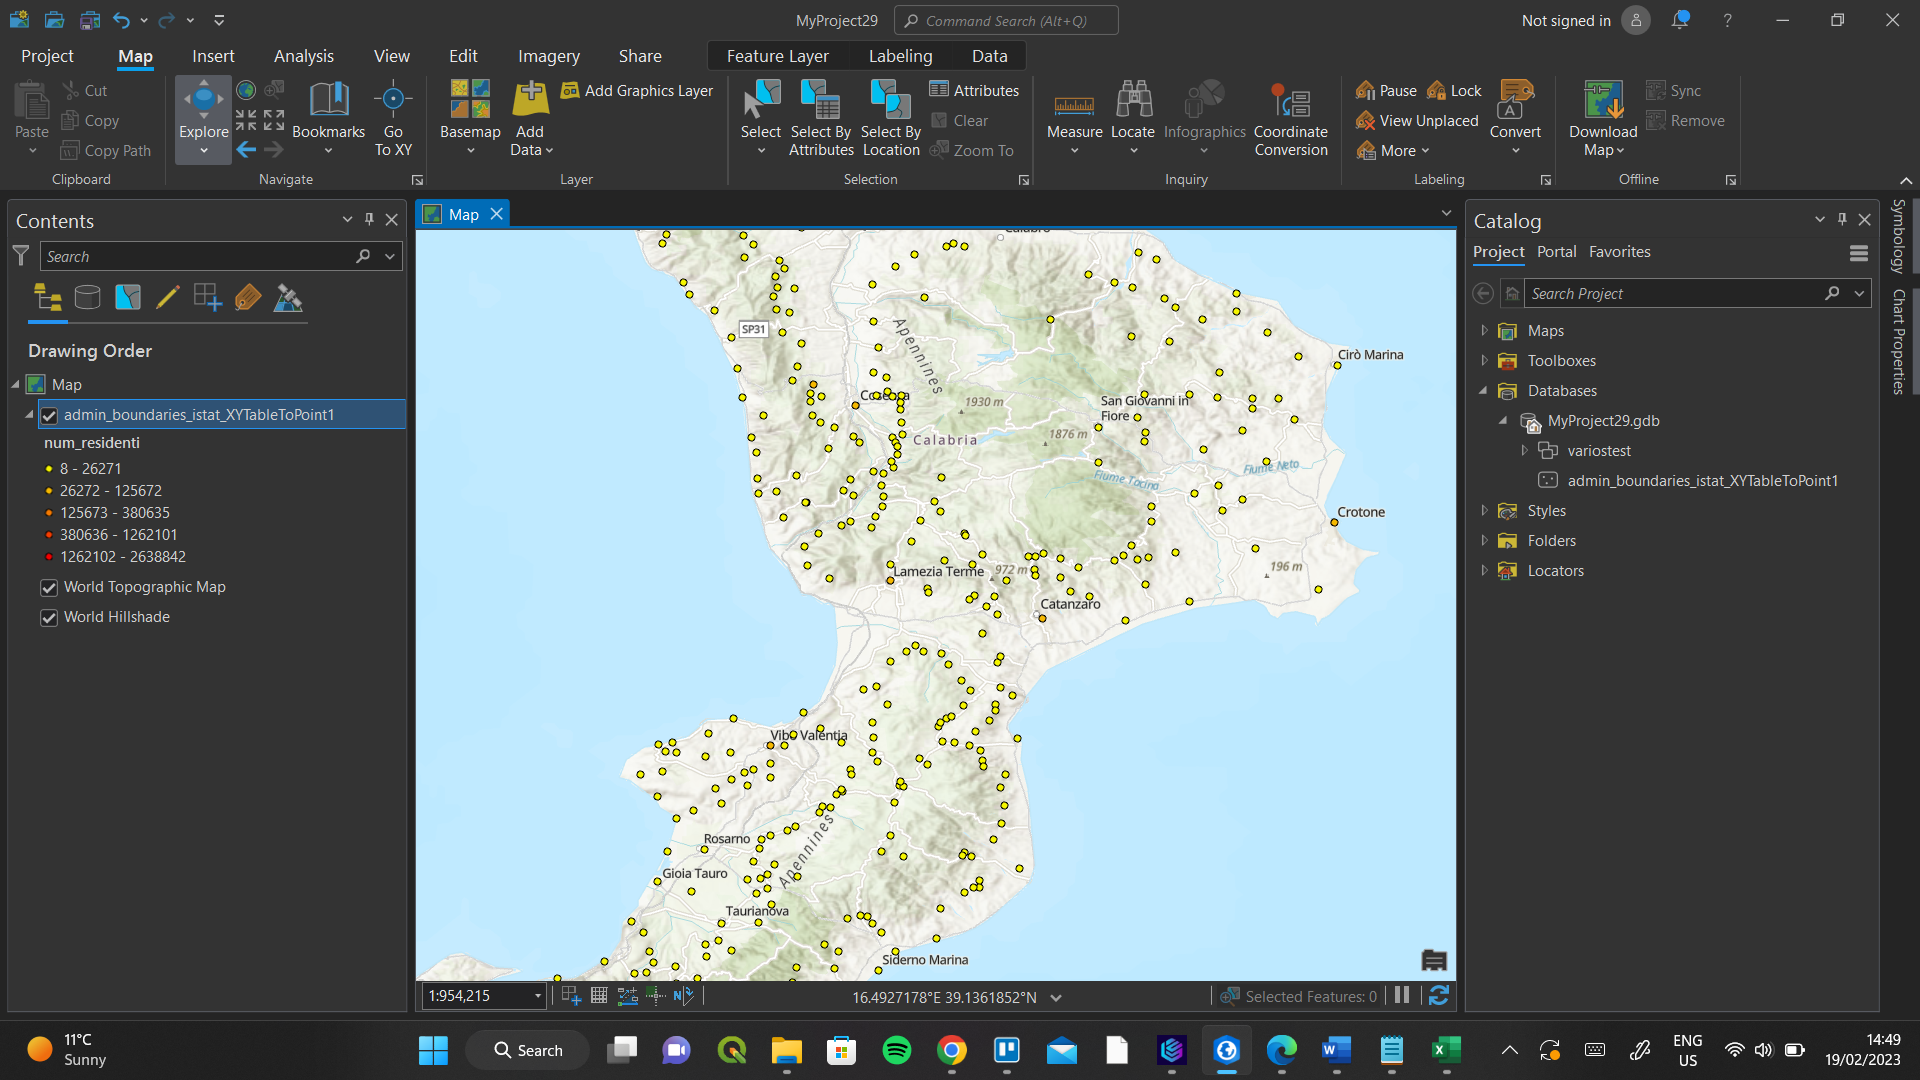
I`m trying to create a choropleth map on ArcGIS Pro for the number of residents of each city in Italy, I add the YX point data on the Map ribbon, get the points on the map, but when I choose graduated colors in the symbology tab I don`t get a choropleth map, I just get a map with points. 😭
My spreadsheet contains: longitude, latitude, population, zip code (CAP), city, province, region, etc.
Do I need data such as shape area, shape length, surface, pop/sq km, or any other data to get it right?
I previously managed to create a choropleth map by doing a join of this data with the administrative boundaries data of Italy. I exported the file, and I`m trying to use the same exported file but I can`t seem to get it right. I keep experimenting and deleting some columns to see if they are the issue but nothing works...
Pictures and dataset attached.
Anyone out there to help? Forever grateful 😊
Roger
Solved! Go to Solution.
Accepted Solutions
- Mark as New
- Bookmark
- Subscribe
- Mute
- Subscribe to RSS Feed
- Permalink
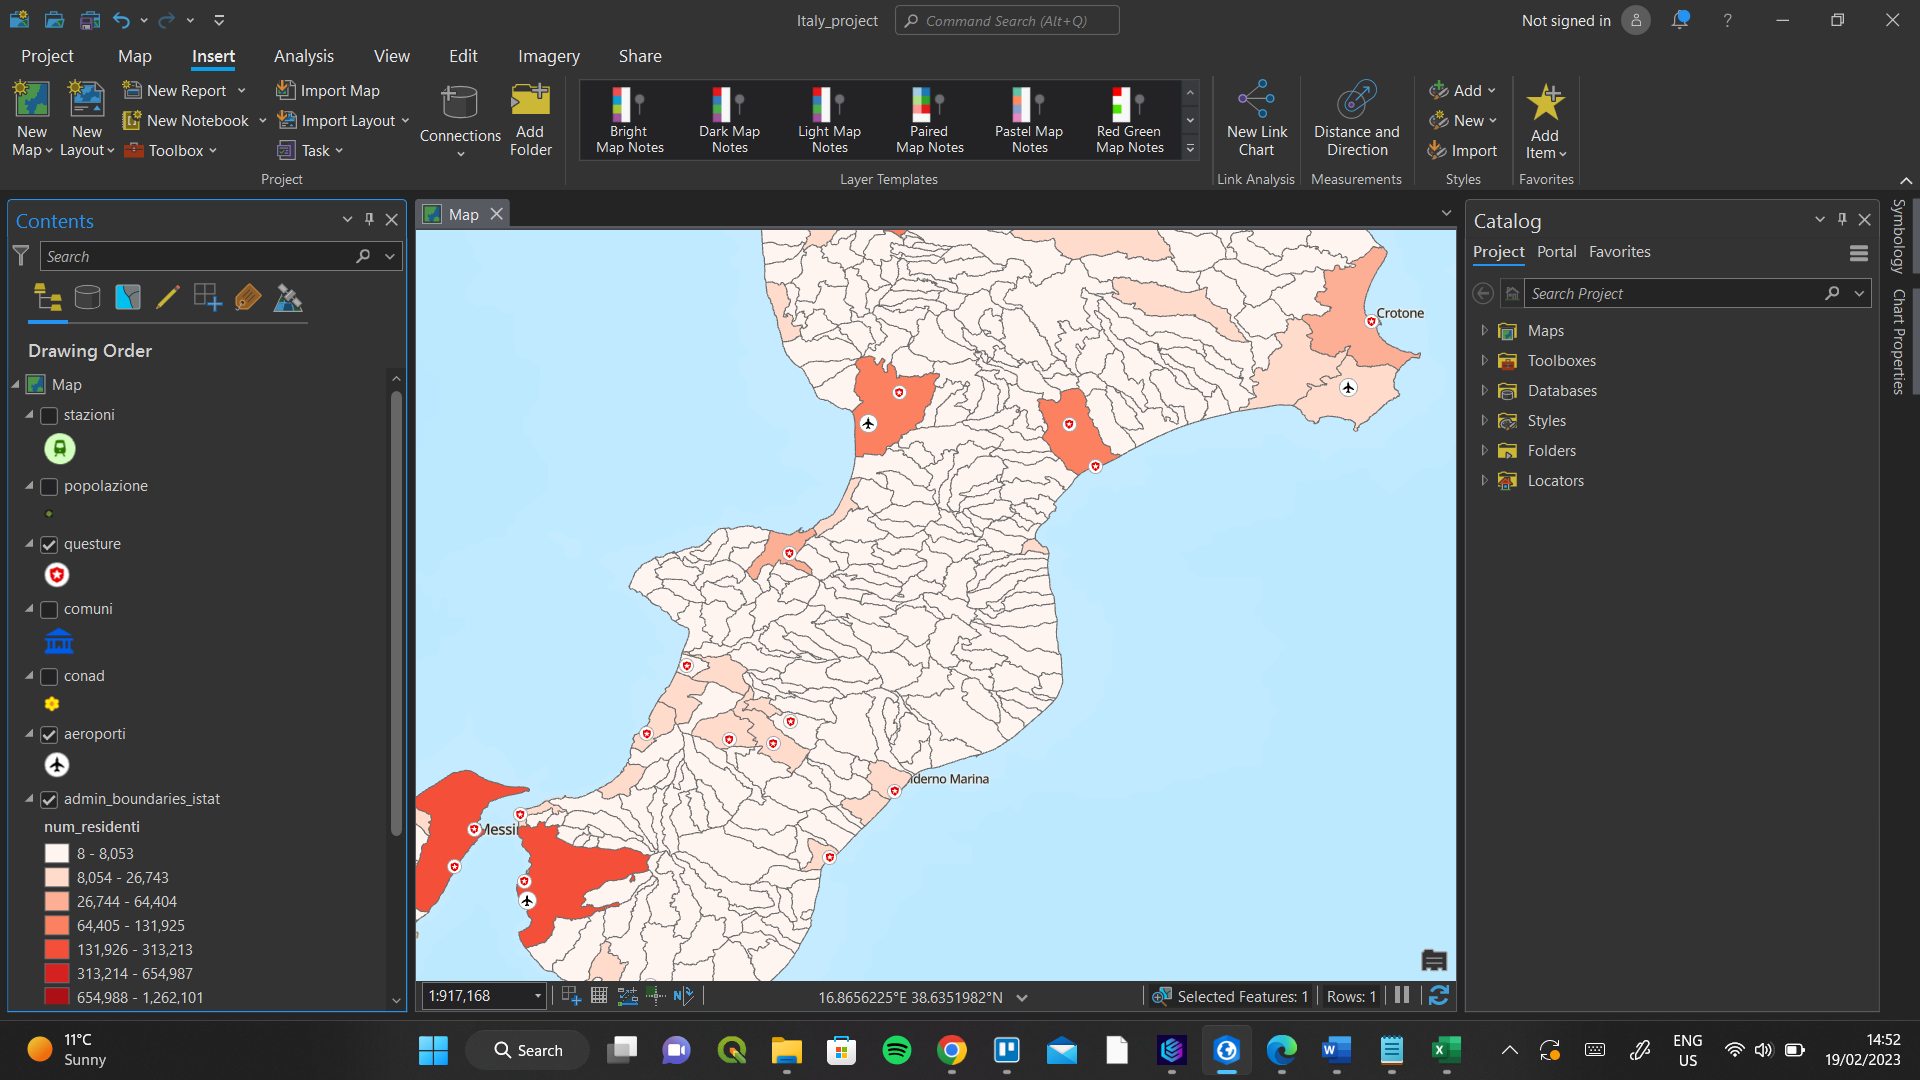
You'd need to join the point data attributes to the admin boundary polygons, it seems you're doing this the wrong way around. The polygons would then take on the attributes from the points and you would symbolise those polygons by quantity etc.
I also think you would be better using a spatial join if you don't have a 1-to-1 mapping of points to polygons. That way you would be able to sum values if you have multiple points per polygon.
https://pro.arcgis.com/en/pro-app/latest/tool-reference/analysis/spatial-join.htm
target features - your polygons (administartive regions)
join features - your points
out fc - output path to create a new feature
join operation - one to one
join type - keep all
field mapping - specify the field containing the values you want transferred - you can also set sum/first etc options for each field (these rules are for how to handle multiple points per polygon)
match option - intersect
- Mark as New
- Bookmark
- Subscribe
- Mute
- Subscribe to RSS Feed
- Permalink
Hey David, I finally got it. I performed the spatial join as you said using the admin boundaries layer, then bringing in the points data to conserve the shape field as POLYGON in the attributes table! 😁 I was wondering why my exported table (from the previous join) was not working even though it had the same data in there, but now doing it again as you said worked out just fine, so thank you so much for the help!

- Mark as New
- Bookmark
- Subscribe
- Mute
- Subscribe to RSS Feed
- Permalink
You'd need to join the point data attributes to the admin boundary polygons, it seems you're doing this the wrong way around. The polygons would then take on the attributes from the points and you would symbolise those polygons by quantity etc.
I also think you would be better using a spatial join if you don't have a 1-to-1 mapping of points to polygons. That way you would be able to sum values if you have multiple points per polygon.
https://pro.arcgis.com/en/pro-app/latest/tool-reference/analysis/spatial-join.htm
target features - your polygons (administartive regions)
join features - your points
out fc - output path to create a new feature
join operation - one to one
join type - keep all
field mapping - specify the field containing the values you want transferred - you can also set sum/first etc options for each field (these rules are for how to handle multiple points per polygon)
match option - intersect
- Mark as New
- Bookmark
- Subscribe
- Mute
- Subscribe to RSS Feed
- Permalink
Hi! Saw this answer and wondered if you know the workflow for a ZIP choropleth map using just the Excel plugin from ArcGIS for Office v2022.1?
- Mark as New
- Bookmark
- Subscribe
- Mute
- Subscribe to RSS Feed
- Permalink
Sorry Jay, not dealt with the Excel plugin before unfortunately.
- Mark as New
- Bookmark
- Subscribe
- Mute
- Subscribe to RSS Feed
- Permalink
No worries. I figured it out myself. I was confused because the NEW workflow makes sense and involves no hidden weird features--unlike the old one.
Wow, that Excel plugin really had a lot of features added for 2022.1. Too bad it's already DOA for the Office365 version--which I hope I can get working at some point.
Thanks! Good luck!
- Mark as New
- Bookmark
- Subscribe
- Mute
- Subscribe to RSS Feed
- Permalink
Hey David, I finally got it. I performed the spatial join as you said using the admin boundaries layer, then bringing in the points data to conserve the shape field as POLYGON in the attributes table! 😁 I was wondering why my exported table (from the previous join) was not working even though it had the same data in there, but now doing it again as you said worked out just fine, so thank you so much for the help!