- Home
- :
- All Communities
- :
- Products
- :
- ArcGIS Online
- :
- ArcGIS Online Questions
- :
- Re: Can I use Arcade expressions configured in pop...
- Subscribe to RSS Feed
- Mark Topic as New
- Mark Topic as Read
- Float this Topic for Current User
- Bookmark
- Subscribe
- Mute
- Printer Friendly Page
Can I use Arcade expressions configured in pop-ups, also in Dashboards?
- Mark as New
- Bookmark
- Subscribe
- Mute
- Subscribe to RSS Feed
- Permalink
- Report Inappropriate Content
I'm new to using Arcade expressions in my map pop-ups and l just finished a really useful one for myself with the help of Xander Bakker. But I now would like to "present" or show that information in a Dashboard. My longer term goal is to place useful information, like below, within dashboards and display that information to our employees.
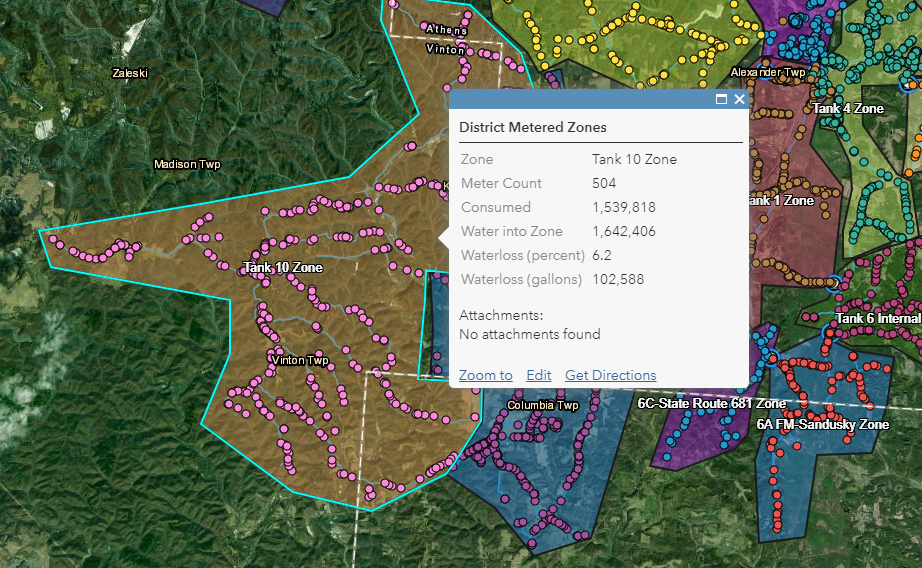
Below is the map I just completed. If I click on a "Zone" it displays the Meter Count, the water consumed by our customers in that Zone, the amount of Water pumped into the Zone and the amount of waterloss within that Zone in gallons and percent. Those are all being calculated by expressions in the pop-up. Is there an easy way to gather that same information in a Dashboard? If I could run the expressions once for every zone, and then save that info and display it on a bar chart or pie chart for % waterloss or something along those lines, it would be really beneficial. Can anyone suggest a good direction to purse on that?
Thank you,
Travis
- Mark as New
- Bookmark
- Subscribe
- Mute
- Subscribe to RSS Feed
- Permalink
- Report Inappropriate Content
Hi le-ax ,
At this moment there is no support for using FeatureSetBy* and accessing other data for use in charts in ArcGIS Dashboards or ArcGIS Dashboards Beta. The beta version has support in some of the elements but not to do what you are aiming for. The pop-up will show however and list elements will be able to access the attribute of the data point, but there is no access to data from other features or featuresets.
You can however create an additional field, and use ArcGIS Pro and a scheduled GP task to update the content and have that reflected in a Dashboard. Not sure if that is an option for you in this case.