Turn on suggestions
Auto-suggest helps you quickly narrow down your search results by suggesting possible matches as you type.
Cancel
- Home
- :
- All Communities
- :
- Products
- :
- ArcGIS Online
- :
- ArcGIS Online Questions
- :
- ArcGIS quantile classification method results in u...
Options
- Subscribe to RSS Feed
- Mark Topic as New
- Mark Topic as Read
- Float this Topic for Current User
- Bookmark
- Subscribe
- Mute
- Printer Friendly Page
ArcGIS quantile classification method results in unequal data values in each class
Subscribe
436
0
07-13-2020 05:12 AM
07-13-2020
05:12 AM
- Mark as New
- Bookmark
- Subscribe
- Mute
- Subscribe to RSS Feed
- Permalink
- Report Inappropriate Content
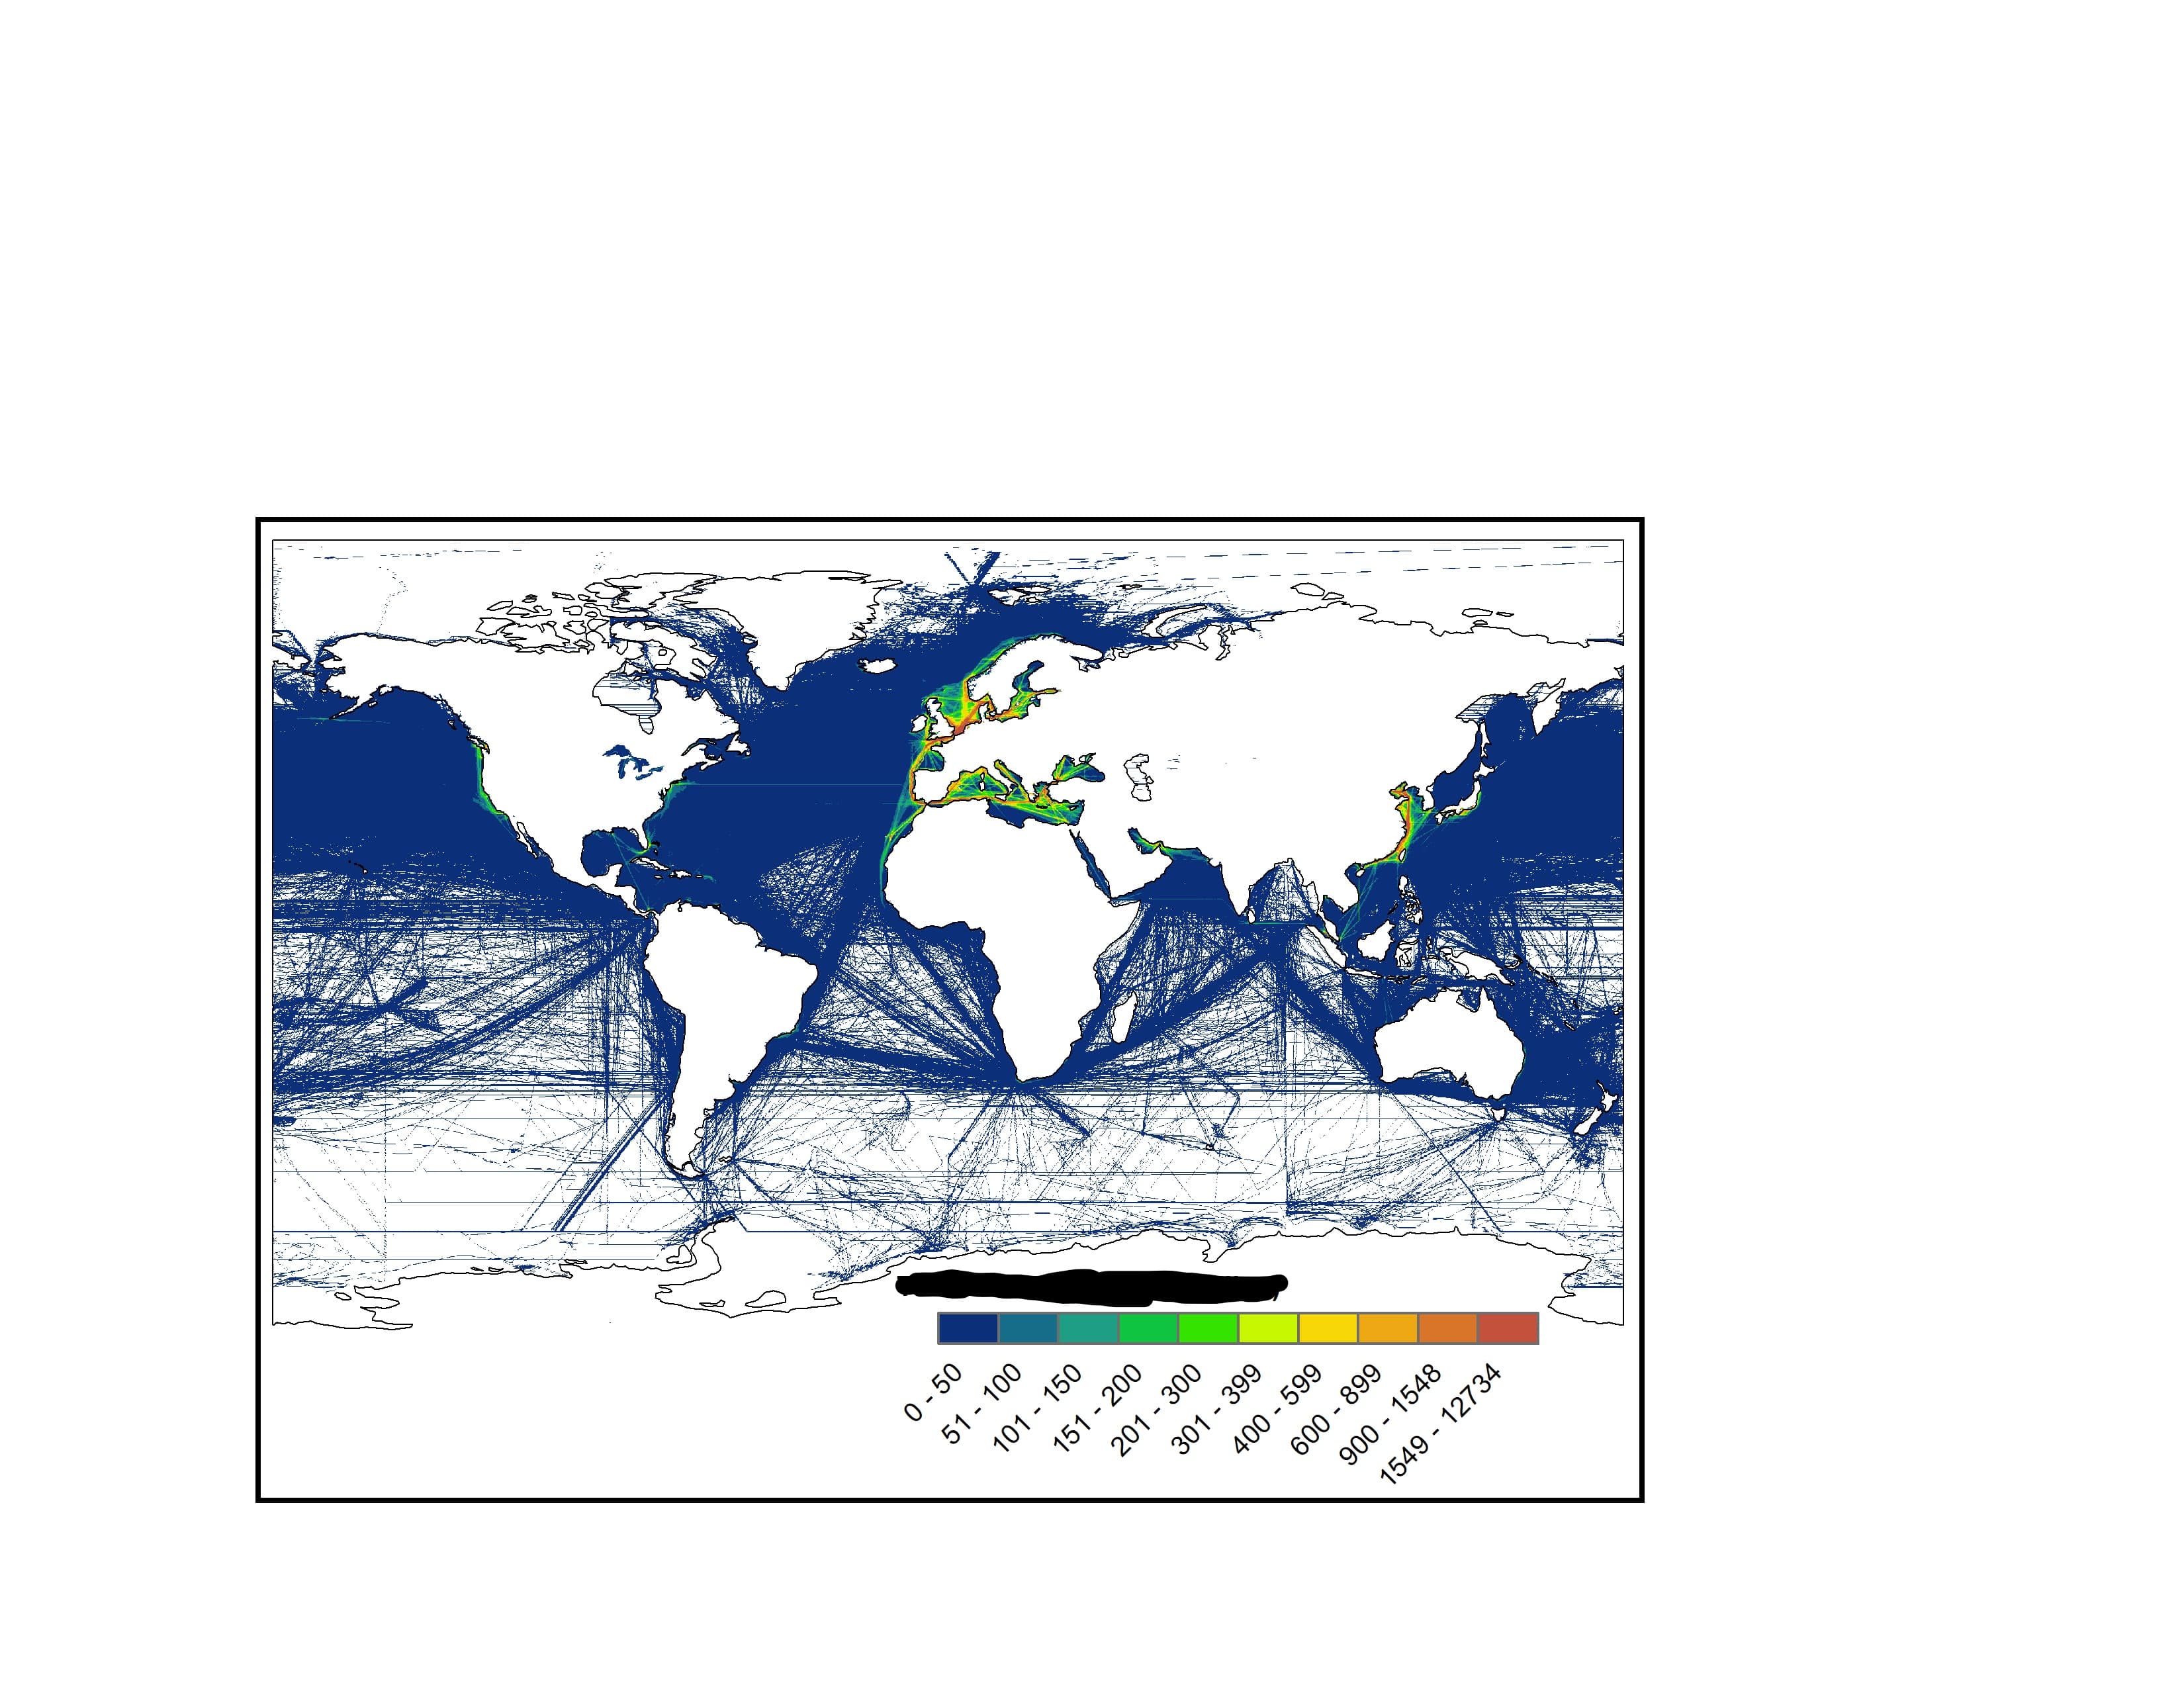
I have a raster dataset which I visualized in ArcMap 10.6.1. I used the quantile data classification method to assign colours to the data values. ESRI's documentation says the following about quantiles: "Quantile assigns the same number of data values to each class". Thus, I would expect a raster map that looks something like this. However, I end up with the map below.
Does anyone have an explanation for the unexpected outcome of the quantile classification? Could it have something to do with the distribution of the values? All values in the open ocean are very low (0-50), while values near coastlines can be very high (up to 12734). Unfortunately I am not allowed to share the actual data due to confidentiality.
0 Replies