- Home
- :
- All Communities
- :
- Products
- :
- Mapping and Charting Solutions
- :
- Mapping and Charting Questions
- :
- How can I show fewer contour lines?
- Subscribe to RSS Feed
- Mark Topic as New
- Mark Topic as Read
- Float this Topic for Current User
- Bookmark
- Subscribe
- Mute
- Printer Friendly Page
How can I show fewer contour lines?
- Mark as New
- Bookmark
- Subscribe
- Mute
- Subscribe to RSS Feed
- Permalink
- Report Inappropriate Content
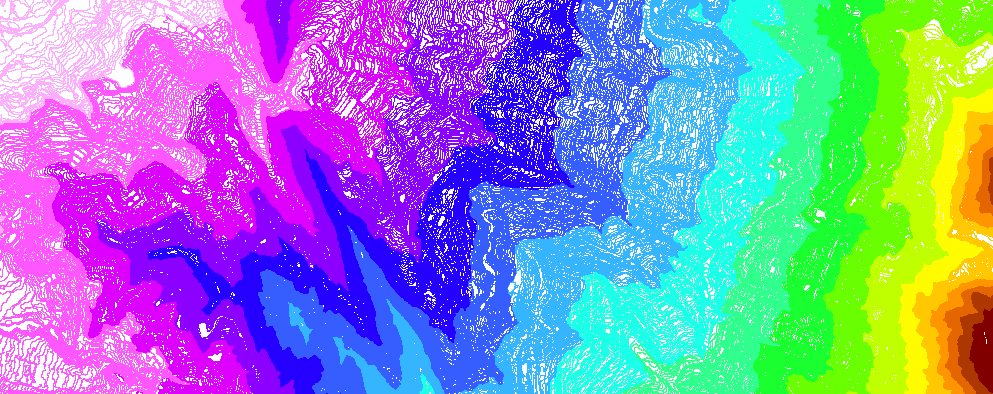
The shape file with Contour Lines in the image below has a lot of data. I tried making the contour lines below very thin but the lines are so tight they are obscuring the terrain below. I there a way I can show fewer contour lines?
Solved! Go to Solution.
Accepted Solutions
- Mark as New
- Bookmark
- Subscribe
- Mute
- Subscribe to RSS Feed
- Permalink
- Report Inappropriate Content
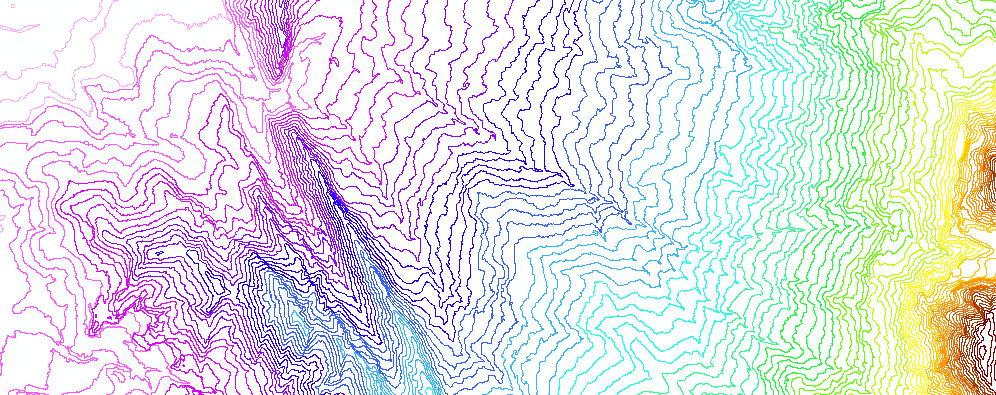
As explained in this thread: https://community.esri.com/thread/103594 there are several ways to do this. If my contour lines are for instance every meter:
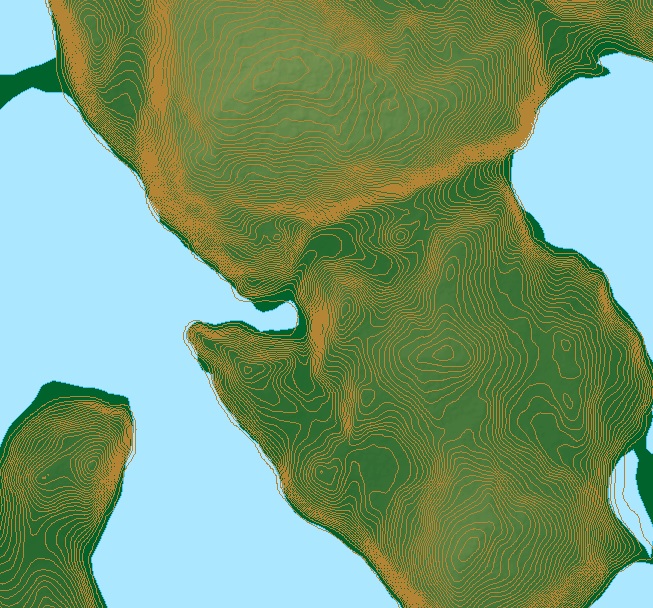
... and I want to show the contours every 10 meter, like this:
I can go into the layer properties and specify a definition query like:
mod( CNiAltura , 10) = 0
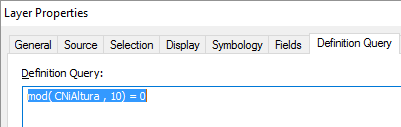
In this case "CNiAltura" is the field that contains the height of each contour line.
Change the field name and the value 10 to your specific needs.
- Mark as New
- Bookmark
- Subscribe
- Mute
- Subscribe to RSS Feed
- Permalink
- Report Inappropriate Content
As explained in this thread: https://community.esri.com/thread/103594 there are several ways to do this. If my contour lines are for instance every meter:
... and I want to show the contours every 10 meter, like this:
I can go into the layer properties and specify a definition query like:
mod( CNiAltura , 10) = 0
In this case "CNiAltura" is the field that contains the height of each contour line.
Change the field name and the value 10 to your specific needs.
- Mark as New
- Bookmark
- Subscribe
- Mute
- Subscribe to RSS Feed
- Permalink
- Report Inappropriate Content
This just saved me so much time messing around with tools, so thank you!!! 
- Mark as New
- Bookmark
- Subscribe
- Mute
- Subscribe to RSS Feed
- Permalink
- Report Inappropriate Content
Check out Displaying a subset of features in a layer.
With contour lines, typically the elevation of the contour will be included as an attribute of the contour line. If I am working with 2 foot contour lines and only want to display 10 foot lines, a definition query like MOD(elevation, 10) = 0 would do the job. If the dataset is very large, having an index on the elevation value field might help the performance of the definition query.
- Mark as New
- Bookmark
- Subscribe
- Mute
- Subscribe to RSS Feed
- Permalink
- Report Inappropriate Content
Thank you Xander and Joshua, I used your solutions and it worked perfectly. I really appreciate your advice.
- Mark as New
- Bookmark
- Subscribe
- Mute
- Subscribe to RSS Feed
- Permalink
- Report Inappropriate Content
or you could use the ContourList tool and create a selected set of contours. For example, you might want contours every 50 for values less than 200 and then every 100 thereafter.
ContourList("elevation", "C:/sapyexamples/output/outcontourlist.shp", [0, 50, 100, 150, 200, 300, 400, 500, 600])
- Mark as New
- Bookmark
- Subscribe
- Mute
- Subscribe to RSS Feed
- Permalink
- Report Inappropriate Content
Do you need a Spatial Analyst extension to use the ContourList tool?
- Mark as New
- Bookmark
- Subscribe
- Mute
- Subscribe to RSS Feed
- Permalink
- Report Inappropriate Content
It is part of Spatial Analyst and 3D Analyst
- Mark as New
- Bookmark
- Subscribe
- Mute
- Subscribe to RSS Feed
- Permalink
- Report Inappropriate Content
Thank you, I didn't even know the ContourList tool existed. I will check the tool and learn about it.