- Home
- :
- All Communities
- :
- Products
- :
- ArcGIS Living Atlas of the World
- :
- Living Atlas Blog
- :
- Automatically Resize Symbols by Map Scale in Arcad...
Automatically Resize Symbols by Map Scale in Arcade
- Subscribe to RSS Feed
- Mark as New
- Mark as Read
- Bookmark
- Subscribe
- Printer Friendly Page
- Report Inappropriate Content
Blog Author: Emily Meriam Originally Published: ArcGIS
Did you know that you can create custom Arcade expressions to define your symbol sizes at the varying ArcGIS Online map scales? The Arcade code demonstrated here on Esri’s “Recent Hurricane” Live Feed will show you how to automatically resize your symbols as you zoom in and out of your map.
Hurricanes!
Within the Living Atlas is a “Recent Hurricane” layer that features tropical cyclone (hurricanes, typhoons, cyclones) tracks and positions from the past year for the Atlantic, Pacific, and Indian Basins. Esri hosts this data from the National Hurricane Center (NHC) and Joint Typhoon Warning Center (JTWC).
For this example you will be copying these links:
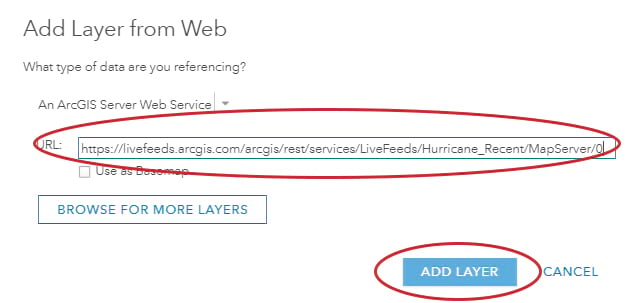
1. Hurricane – Recent Observed Positions (point file) service is located: https://livefeeds.arcgis.com/arcgis/rest/services/LiveFeeds/Hurricane_Recent/MapServer/0
2. Spinning Blue Hurricane (PNG symbol) is located: https://arcgis-content.maps.arcgis.com/sharing/rest/content/items/f67790e2d65143f1af2edca3bab4c739/d...
Monitoring agencies worldwide use varying wind speed criteria and terminology for tropical cyclone classifications. The NHC and JTWC use the Saffir-Simpson Wind Scale to classify storms in the Western Hemisphere. This ranking system places storms with different wind speed thresholds (one-minute maximum sustained wind speed) into the following three classes:
Major (Devastating/Catastrophic)
Category 5 Hurricane: > 137 knots | >157 mph | >252 kmh
Category 4 Hurricane: 113-136 knots | 130-156 mph | 209-251 kmh
Category 3 Hurricane: 96-112 knots | 111-129 mph | 178-208 kmh
Very/Extremely Dangerous
Category 2 Hurricane: 83-95 knots | 96-110 mph | 154-177 kmh
Category 1 Hurricane: 64-82 knots | 74-95 mph | 119-153 kmh
Related Classifications
Tropical Depression: <33 knots| <38 mph | <62 kmh
Tropical Storm: 34-63 knots | 39-73 mph |63-118 kmh
Symbology
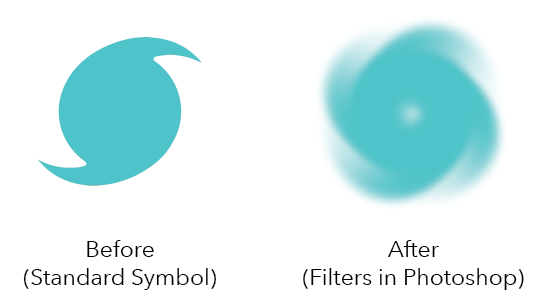
There are standard symbols for hurricanes:

Using the Saffir-Simpson Wind Scale classifications, Category 1-5 Hurricanes will be displayed with a hurricane symbol to differentiate them from Tropical Storms and Depressions.
As a cartographer I see some room for interpretation here. I decide to take the standard symbol and tweak it a bit, so it spins like a hurricane and add an eye. It needs life and vibrations like it is moving, but there also should be a nod to the original symbol. This change makes a visual statement that could be immediately recognizable (abstractly it looks like a hurricane) to someone who is looking at the map and they may not need a legend to determine what the symbol is.
Classify the Hurricane Data in Arcade
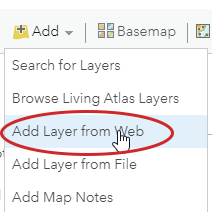
1. Open a new web map and click on Add –> Add Layer from Web
2. Paste in the link listed above for the Hurricane Recent – Observed Positions.
3. By default, the service comes in with a basic symbol that all has the same classification.
This layer has an attribute called INTENSITY. It measures wind speed in knots. Use this to classify the data in Arcade so it is symbolized uniformly with the Saffir-Simpson Wind Scale. Click to “Change Style” on the point layer.

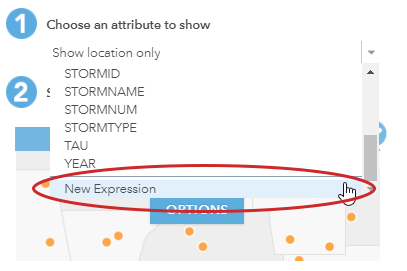
4. Select “Choose an attribute to show” and select to create a “New Expression”.
5. Edit the “Name” (by default it says Custom) at the top to say: Assign Storm Type (Saffir) by Intensity
6. Place this code in the Arcade window:
Var INTENSITY=$feature.INTENSITY
When(INTENSITY>=137,”Category 5 Hurricane”,
INTENSITY<137&&INTENSITY>112, “Category 4 Hurricane”,
INTENSITY<=112&&INTENSITY>95, “Category 3 Hurricane”,
INTENSITY<=95&&INTENSITY>82,”Category 2 Hurricane”,
INTENSITY<=82&&INTENSITY>63, “Category 1 Hurricane”,
INTENSITY<=63&&INTENSITY>33, “Tropical Storm”,
INTENSITY<=33&&INTENSITY>=0, “Tropical Depression”, “NO DATA”)
7. It looks like:

8. What the code is saying: When the wind speed intensity is between this number and that number, identify it as this type of storm.
9. Click “OK”
10. Because of this Arcade expression, the data is now classified and is immediately prompting you to “Select a drawing style”. Select “Types (Unique Symbols)” and click on “Options”.
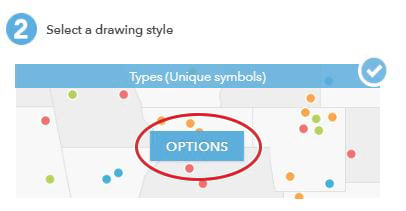
I love that I can use my own custom made symbols (transparent PNG images) in ArcGIS Online! It is so easy to create my own symbols, upload them to my account, share them publicly, and then use them on my maps!
1. First rearrange all your points into the proper order (Category 5-1, Tropical Storm, Tropical Depression) by dragging them up and down while hovering the mouse over the three dots on the left side.
2. Next click on the default symbol for Category 5 Hurricane and Select –> Shapes (drop-down menu) –> Custom Images.
3. Click on “Use an Image” and paste in the “Shared” text box the link listed above for the spinning blue hurricane.
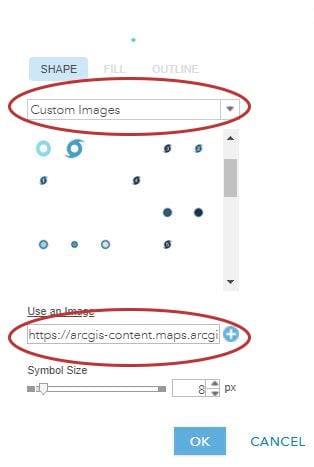
4. Once this symbol has been uploaded as a custom symbol you will just need to “Select” it as it will already be in your symbol gallery. Continue individually for Category 1-4 Hurricanes.
5. Don’t worry about the size of the symbols, keep them at their default. Those will get adjusted in the Arcade expression below.
6. Because the hurricane symbol should only highlight Category 1-5 Hurricanes, for Tropical Storm and Tropical Depression categories select any “Basic” symbol and change the “FILL” and “OUTLINE” to No Color (small box with red slash on it).
7. It will look like:
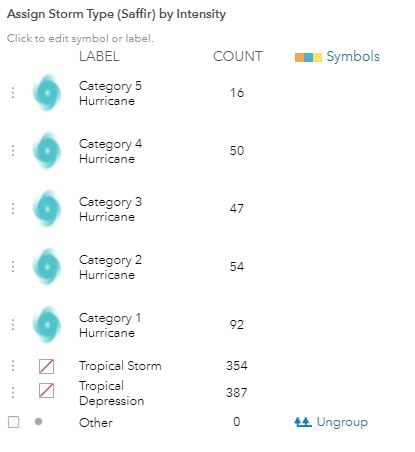
8. Click “OK” and keep the Style Editor open.
Automatically Adjust the Symbol Size in Arcade
While ArcGIS Online doesn’t allow for setting a map reference scale (yet) as you can in Pro, there is a trick through using an Arcade expression.
Using the Saffir-Simpson Wind Scale classes you just set from above, it’s possible to define your map zoom scales (cs) in combination with wind speed classifications (INTENSITY) and set a symbol size at the end of each line.
1. In the Change Style –> Choose and attribute to show window –> Add attribute

2. Using the drop-down menu select “New Expression”.
3. Edit the “Name” at the top to say: Set the Symbol Size by Map Scale
4. Place this code in the Arcade window:
var INTENSITY=$feature.INTENSITY
var cs=$view.scale
When (cs<=74000000&&cs>=37000000&&INTENSITY>=137,30,
cs<=74000000&&cs>=37000000&&INTENSITY<137&&INTENSITY>112,25,
cs<=74000000&&cs>=37000000&&INTENSITY<=112&&INTENSITY>95,20,
cs<=74000000&&cs>=37000000&&INTENSITY<=95&&INTENSITY>82,15,
cs<=74000000&&cs>=37000000&&INTENSITY<=82&&INTENSITY>63,10,
cs<=74000000&&cs>=37000000&&INTENSITY<=63&&INTENSITY>33,0,
cs<=74000000&&cs>=37000000&&INTENSITY<=33&&INTENSITY>=0,0,
cs<37000000&&cs>=18500000&&INTENSITY>=137,37,
cs<37000000&&cs>=18500000&&INTENSITY<137&&INTENSITY>112,32,
cs<37000000&&cs>=18500000&&INTENSITY<=112&&INTENSITY>95,27,
cs<37000000&&cs>=18500000&&INTENSITY<=95&&INTENSITY>82,22,
cs<37000000&&cs>=18500000&&INTENSITY<=82&&INTENSITY>63,18,
cs<37000000&&cs>=18500000&&INTENSITY<=63&&INTENSITY>33,0,
cs<37000000&&cs>=18500000&&INTENSITY<=33&&INTENSITY>=0,0,
cs<18500000&&cs>=9300000&&INTENSITY>=137,65,
cs<18500000&&cs>=9300000&&INTENSITY<137&&INTENSITY>112,55,
cs<18500000&&cs>=9300000&&INTENSITY<=112&&INTENSITY>95,45,
cs<18500000&&cs>=9300000&&INTENSITY<=95&&INTENSITY>82,35,
cs<18500000&&cs>=9300000&&INTENSITY<=82&&INTENSITY>63,25,
cs<18500000&&cs>=9300000&&INTENSITY<=63&&INTENSITY>33,0,
cs<18500000&&cs>=9300000&&INTENSITY<=33&&INTENSITY>=0,0,
cs<9300000&&cs>=1200&&INTENSITY>=137,80,
cs<9300000&&cs>=1200&&INTENSITY<137&&INTENSITY>112,65,
cs<9300000&&cs>=1200&&INTENSITY<=112&&INTENSITY>95,55,
cs<9300000&&cs>=1200&&INTENSITY<=95&&INTENSITY>82,45,
cs<9300000&&cs>=1200&&INTENSITY<=82&&INTENSITY>63,35,
cs<9300000&&cs>=1200&&INTENSITY<=63&&INTENSITY>33,0,
cs<9300000&&cs>=1200&&INTENSITY<=33&&INTENSITY>=0,0,
1)
5. What the code is saying: When the map zoom scale is between this scale and that scale, and the intensity is between this speed and that speed, make the size this number.
6. It looks like:
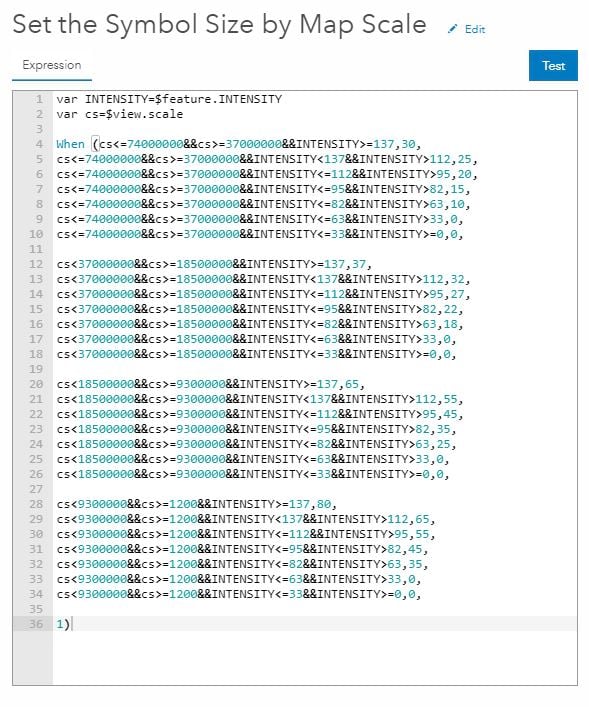
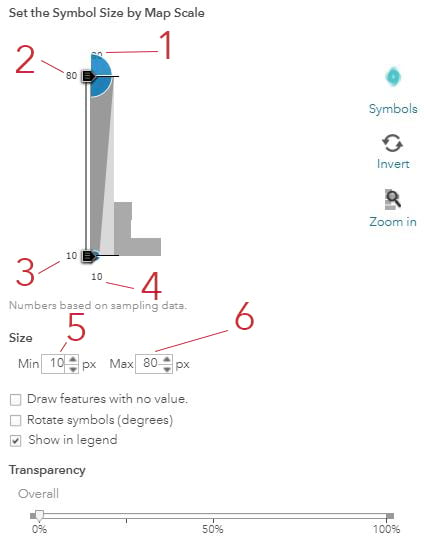
5. Take note that the lowest symbol size is 10 and the highest is 80 (“0” for Tropical Storms and Depressions is omitted). You will need this information again later.
6. Did you notice that the code omits Tropical Storms and Depressions (last two lines of each section the symbol size to “0”)? This is because the spinning blue hurricane symbol only needs to symbolize Category 1-5 Hurricanes and there is another layer (with a filter) in the map that symbolizes Tropical Storms and Depressions. Also take note that the spinning blue hurricane symbol is a PNG file and the Tropical Storms and Depressions are symbolized as basic circle point symbols. The PNG files that you upload, and standard embedded point symbology in ArcGIS Online will have different behaviors and need to have separate Arcade expressions. This is due to minimum and maximum sizing of symbols you will see next in Step 10.
7. Now that I have the two Arcade expressions in the layer and they are applied select “Options” from the drawing style.
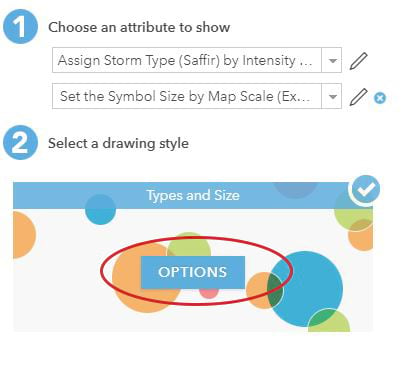
8. Click on “Options” for Counts and Amounts (Size)
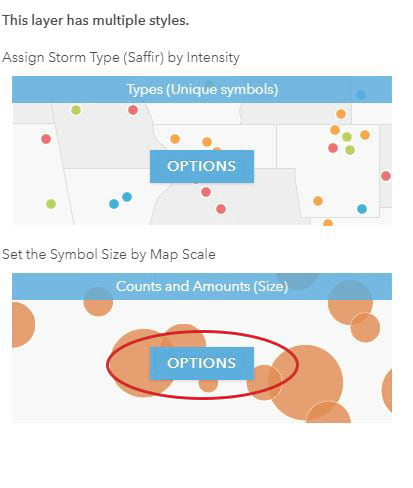
9. Remember the lowest symbol size value is 10 and the highest is 80? Enter in the these high and low values in the following six places for this sizing expression to work (Please note that if you adjust anything in your Arcade code you will need to reenter these again. Any change will override these values):
10. Click “Done”. Both Arcade expressions are embedded within the layer and everything should be now sizing appropriately!

This is the map at 1:74,000,000:
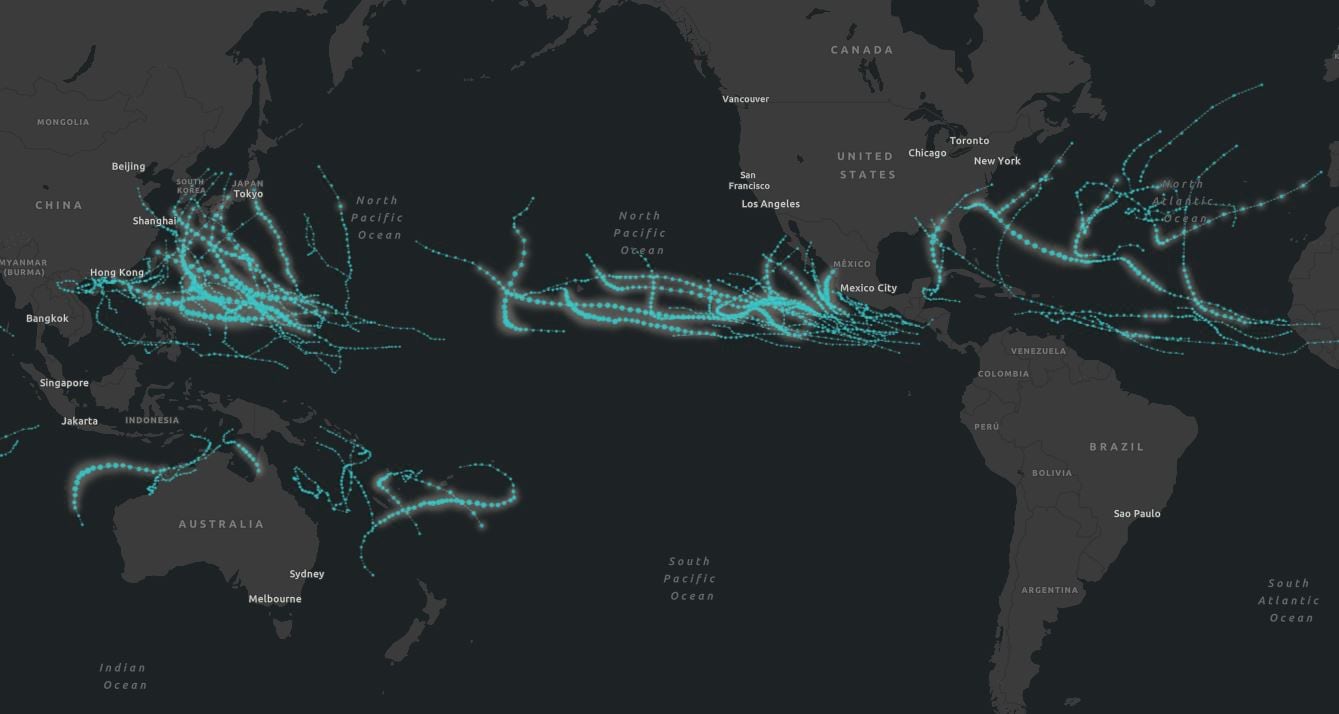
At 1:18,500,000 the hurricane symbol starts to appear:
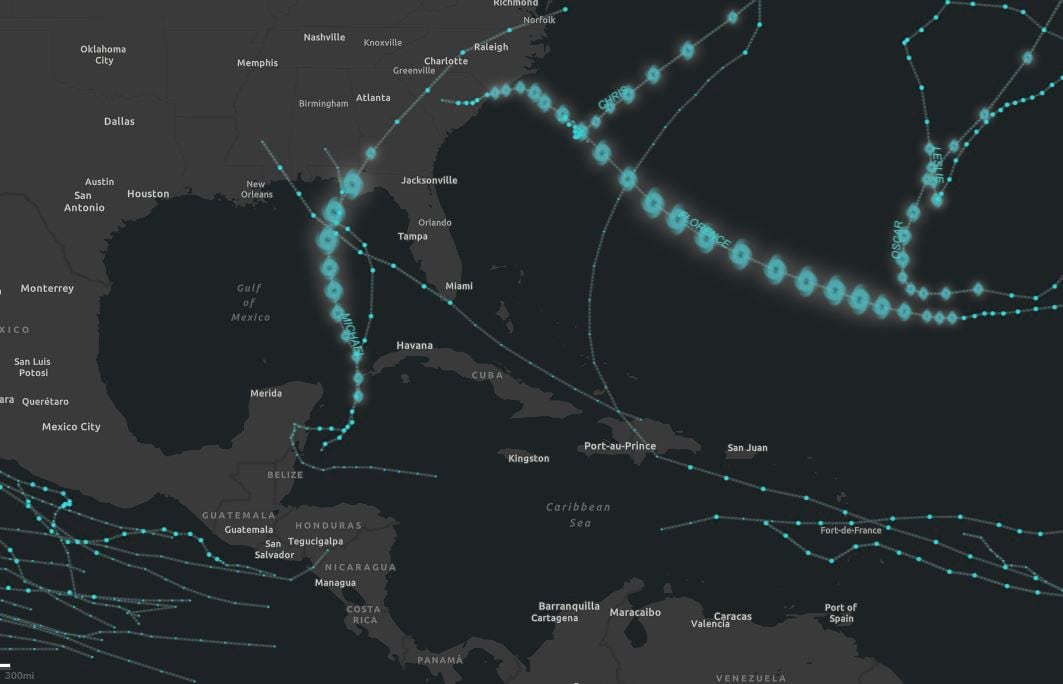
Here is 1:5,000,000 and they are sizing nicely!
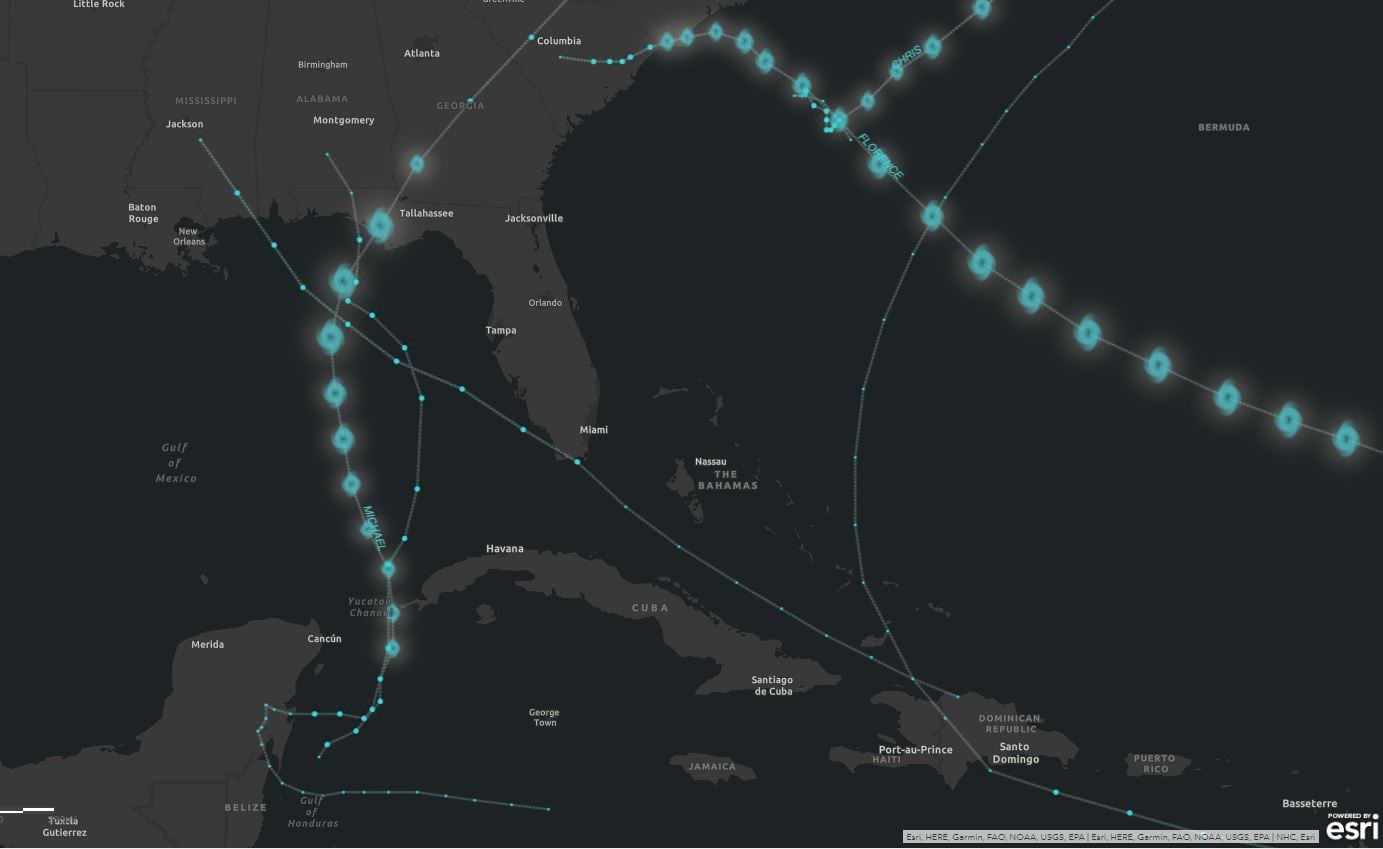
Creating custom Arcade expressions to define symbol sizes at the varying ArcGIS Online map scales will give you more control and your map symbols more presence. The beauty of using these Arcade expressions is that you no longer must replicate layers to show the symbols at all the varying scales, you can now just have one layer in your map and the symbols will size appropriately.
Resources
Here is the web map and app discussed in this blog. Feel free to open them up and copy the Arcade codes for the varying hurricane point and line files.
1. The Recent Hurricanes, Cyclones, and Typhoons (Current Year) web app is here.
2. The Recent Hurricanes, Cyclones, and Typhoons (Current Year) web map is here.
Thank You!
One of the best things about working at Esri is the team and professional camaraderie. My colleague Jennifer Bell deserves special thanks for her assistance with the Arcade expressions and her continuous support and encouragement of my work.
Do you have questions or comments about this blog? Post them in our GeoNet.
You must be a registered user to add a comment. If you've already registered, sign in. Otherwise, register and sign in.