- Home
- :
- All Communities
- :
- Developers
- :
- JavaScript Maps SDK
- :
- JavaScript Maps SDK Questions
- :
- ImageryLayer : get pixel values in polygon
- Subscribe to RSS Feed
- Mark Topic as New
- Mark Topic as Read
- Float this Topic for Current User
- Bookmark
- Subscribe
- Mute
- Printer Friendly Page
ImageryLayer : get pixel values in polygon
- Mark as New
- Bookmark
- Subscribe
- Mute
- Subscribe to RSS Feed
- Permalink
Hello,
I'm trying to build a raster analysis tool :
- users can view raster on their web browser
- they can draw polygons of interest on the map
- they can query for values of the raster's pixels in the polygons extents and get (for each drawn polygon) :
- mean of raster value in the polygon
- histogram of raster value in the polygon
I thought I could use Javascript API to do this but I'm not able to find any method to get ImageryLayer pixel values intersecting a polygon. Is there any ? Furthemore, it seems like if the polygon is not visible on the map, the raster is neither. So accessing pixel value of a polygon which is not visible is impossible. Should I do this another way, using the REST API of the service ?
Thanks for your advices !
- Mark as New
- Bookmark
- Subscribe
- Mute
- Subscribe to RSS Feed
- Permalink
@ClémentLaskar if your raster data is consumed via an Imagery Layer (Image Service) you can use a direct REST call to the service computeStatisticsHistograms endpoint to do what you need.
- Mark as New
- Bookmark
- Subscribe
- Mute
- Subscribe to RSS Feed
- Permalink
Hi John and thanks for your answer. Looking at the doc of Statistics and Histograms in the REST API, I don't understand what exactly contains the "histograms" response attribute and how are they customizable? I don't see any query attributes to specify the classes breaks I want to get, are there any ?
Thanks a lot !
- Mark as New
- Bookmark
- Subscribe
- Mute
- Subscribe to RSS Feed
- Permalink
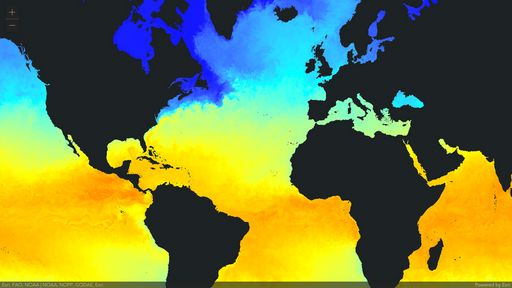
You can use the mosaicRule and renderingRule to control the pixels used in the calculations. For the histogram, applying a proper mosaicRule and renderingRule is vital to make sure your stats reflect the necessary data ranges and values. It will all depend on the type of data and how its configured and published. I normally like to remap the data into simple meaningful groupings to make it simpler for the users of the apps to make sense of the data. Here's a quick codepen showing how to make the call and retrieve the results; I hope this helps.
- Mark as New
- Bookmark
- Subscribe
- Mute
- Subscribe to RSS Feed
- Permalink
Hi John,
Thanks a lots for your codepen, i'll try it with my datas and see if it works !
- Mark as New
- Bookmark
- Subscribe
- Mute
- Subscribe to RSS Feed
- Permalink
@ClémentLaskar - just wanted to let you know that this functionality is now (4.18) available as a method directly on the ImageryLayer class; see details here. I've also updated the codepen to show this new coding pattern.
- Mark as New
- Bookmark
- Subscribe
- Mute
- Subscribe to RSS Feed
- Permalink
Hi @JohnGrayson , thanks for the update, I took a look at the doc and it seems pretty straightforward !
Digging into my problem, I know now where is my issue : once you get the histogram of 0-255 values with number of pixels for each, how do you associate each value (0-255) to a use case value (in your codepen, water temperature) ? With statistics mix and max you get 0 and 255 but what about the values between ?
Thanks a lot !
Clément
- Mark as New
- Bookmark
- Subscribe
- Mute
- Subscribe to RSS Feed
- Permalink
Correct, as mentioned previously, "...applying a proper mosaicRule and renderingRule is vital to make sure your stats reflect the necessary data ranges and values." There is no single approach that works for all use-cases. I like to remap the pixels into human understandable categories; for the temp data I might use 5 or 10 degree intervals as integers so that I can then more easily associate a specific category with a specific range of values. Other approaches might be to use a linear stretch and then do a simple interpolation. Most times I just want to show a histogram chart so I'm not necessarily worried about the specific range of values in each bin. A couple of RasterFunctions that have helped in the past are Stretch and Remap,
- Mark as New
- Bookmark
- Subscribe
- Mute
- Subscribe to RSS Feed
- Permalink
Hi John,
I looked at your codepen again and there is one last thing I can't figure out :
the data you're using has a symbology (color with three canals I guess), but you still get access to the original service value when you query it.
I was trying to do the same in my app but when the layer service gets the RGB symbology, I get 3 histograms with max value at 255 (indeed, it's each color level for the pixel).
How can I achieve the same thing as the service you're using, and get a colored service that sends back original values when it's called ?
I link this Geonet post that is on the same subject and has gotten no answer till now
Thanks a lots for your help !
Clément
