- Home
- :
- All Communities
- :
- Products
- :
- ArcGIS Hub
- :
- ArcGIS Hub Questions
- :
- Chart doesn't sort date properly
- Subscribe to RSS Feed
- Mark Topic as New
- Mark Topic as Read
- Float this Topic for Current User
- Bookmark
- Subscribe
- Mute
- Printer Friendly Page
Chart doesn't sort date properly
- Mark as New
- Bookmark
- Subscribe
- Mute
- Subscribe to RSS Feed
- Permalink
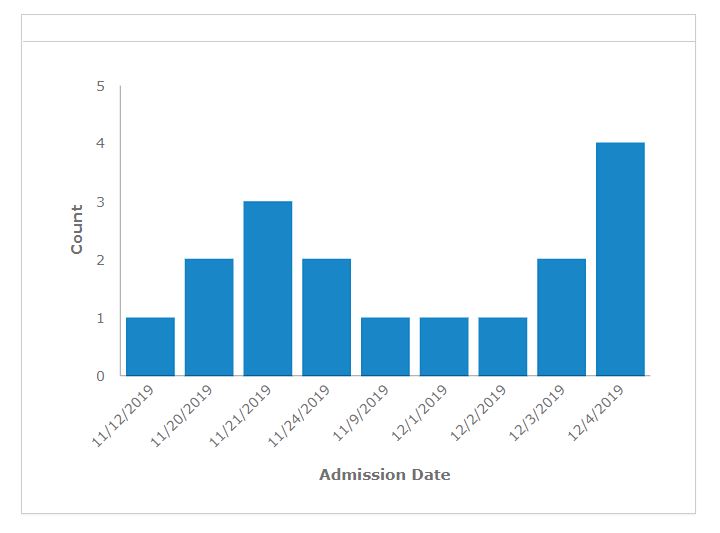
I'm trying to make a chart that shows the occurrence of certain events over time, but the chart sorts the dates incorrectly. It's sorting based off of the day digit so since there is a 1 in the number 12 it is going before the 9th. Any thoughts on how to change this? I'm using data that's being brought in from a Survey123 form so I was hoping this would be compatible, but it seems like I'm going to have to change the format of the date in order for it to work properly.

- Mark as New
- Bookmark
- Subscribe
- Mute
- Subscribe to RSS Feed
- Permalink
Hello Leif,
Is your data stored in a text/string field, or in a date field?
Text-speaking, the chart is sorting the items properly by moving from one character to the next, left to right, and putting them in numerical order.
11/12/2019
11/20/2019
11/21/2019
11/24/2019
11/9/2019
12/1/2019
12/2/2019
12/3/2019
12/4/2019
The chart may not recognize this field as a "Date" format, so therefore it will treat it the same way it would treat any other text/string.
Can you create a field with type date, and does it act the same way?
Thanks!
Rachel G
Esri Support Services
ArcGIS Online Technology Lead
Esri Support Services
- Mark as New
- Bookmark
- Subscribe
- Mute
- Subscribe to RSS Feed
- Permalink
Thanks for the help Rachel. It seems to be recognizing it as a date as you can see on the left side it's showing a little calendar next to the field and allowing me to choose "year, month, day, or hour". I tried it with the "created date" as well and it does the same thing. I'm not sure if it's just because I'm loading it from Survey123. I'll try to load it from a different source and see what happens.
This is a completely different feature that I loaded from ArcPro and it seems to be doing the same thing.

- Mark as New
- Bookmark
- Subscribe
- Mute
- Subscribe to RSS Feed
- Permalink
Thanks for running that test!
I can definitely try to reproduce the issue here. Can you clarify your steps to getting to the chart? Is this on Operations Dashboard, Web AppBuilder, some other client or platform, etc.? Or is this perhaps on a customized page in Hub? The more info you can provide, the better.
Thank you!
Best regards,
Rachel G
Esri Support Services
ArcGIS Online Technology Lead
Esri Support Services
- Mark as New
- Bookmark
- Subscribe
- Mute
- Subscribe to RSS Feed
- Permalink
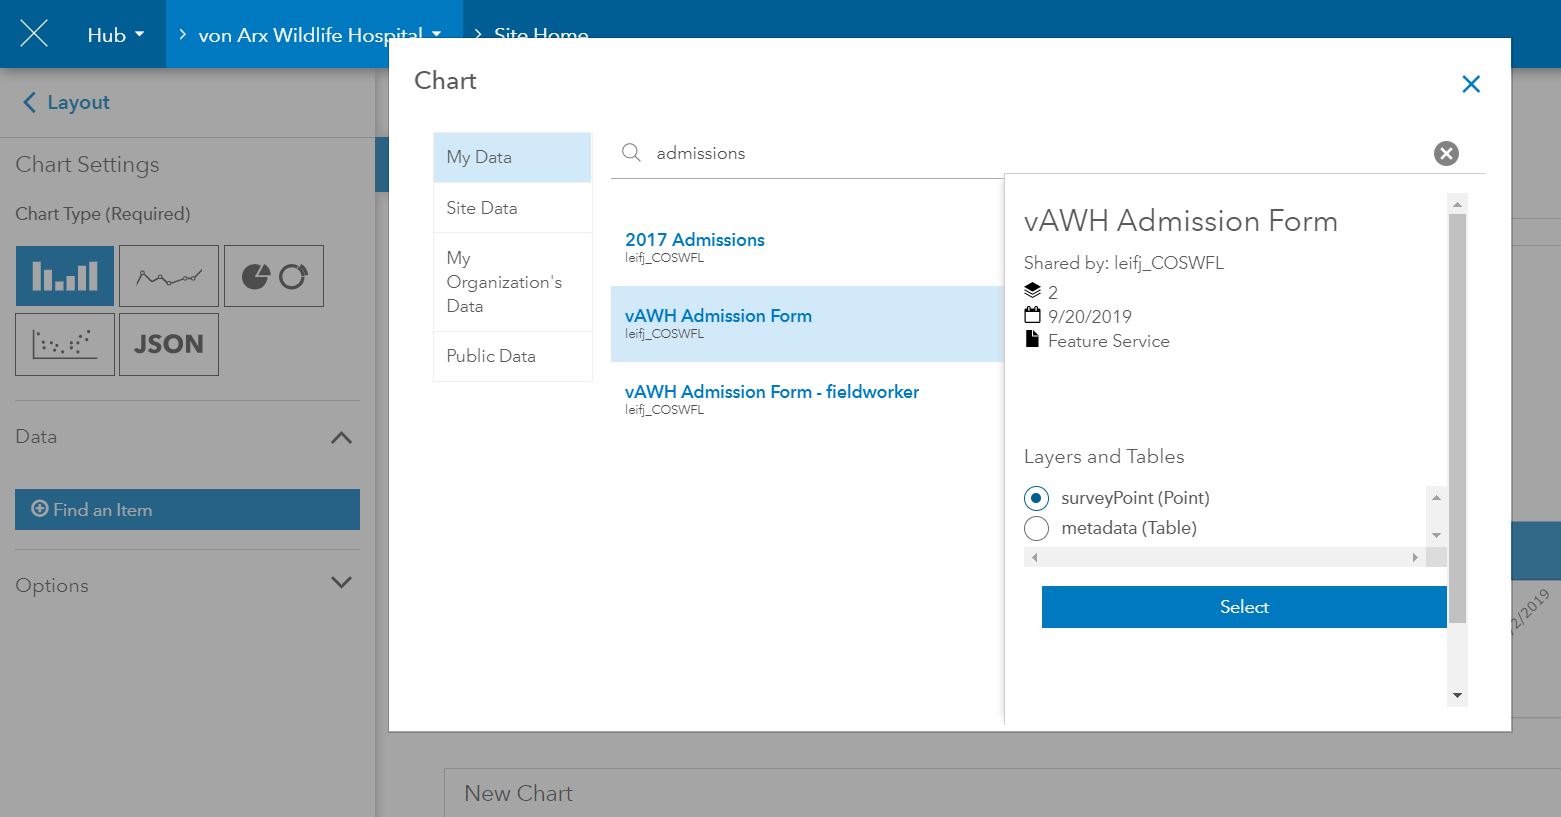
Hey Rachel, thanks for sticking with me. The feature that I brought in is a simple survey123 form with geolocations, no dashboards or other apps involved. In ArcGIS Hub I just clicked Layout > Chart and selected the survey as the "Data" to display. The survey has a date field and that's the field I selected to make the chart from.
- Mark as New
- Bookmark
- Subscribe
- Mute
- Subscribe to RSS Feed
- Permalink
Has there been any progress made on this issue by chance?