- Home
- :
- All Communities
- :
- Products
- :
- ArcGIS Hub
- :
- ArcGIS Hub Questions
- :
- Re: Chart Card Arc GIS Hub
- Subscribe to RSS Feed
- Mark Topic as New
- Mark Topic as Read
- Float this Topic for Current User
- Bookmark
- Subscribe
- Mute
- Printer Friendly Page
Chart Card Arc GIS Hub
- Mark as New
- Bookmark
- Subscribe
- Mute
- Subscribe to RSS Feed
- Permalink
- Report Inappropriate Content
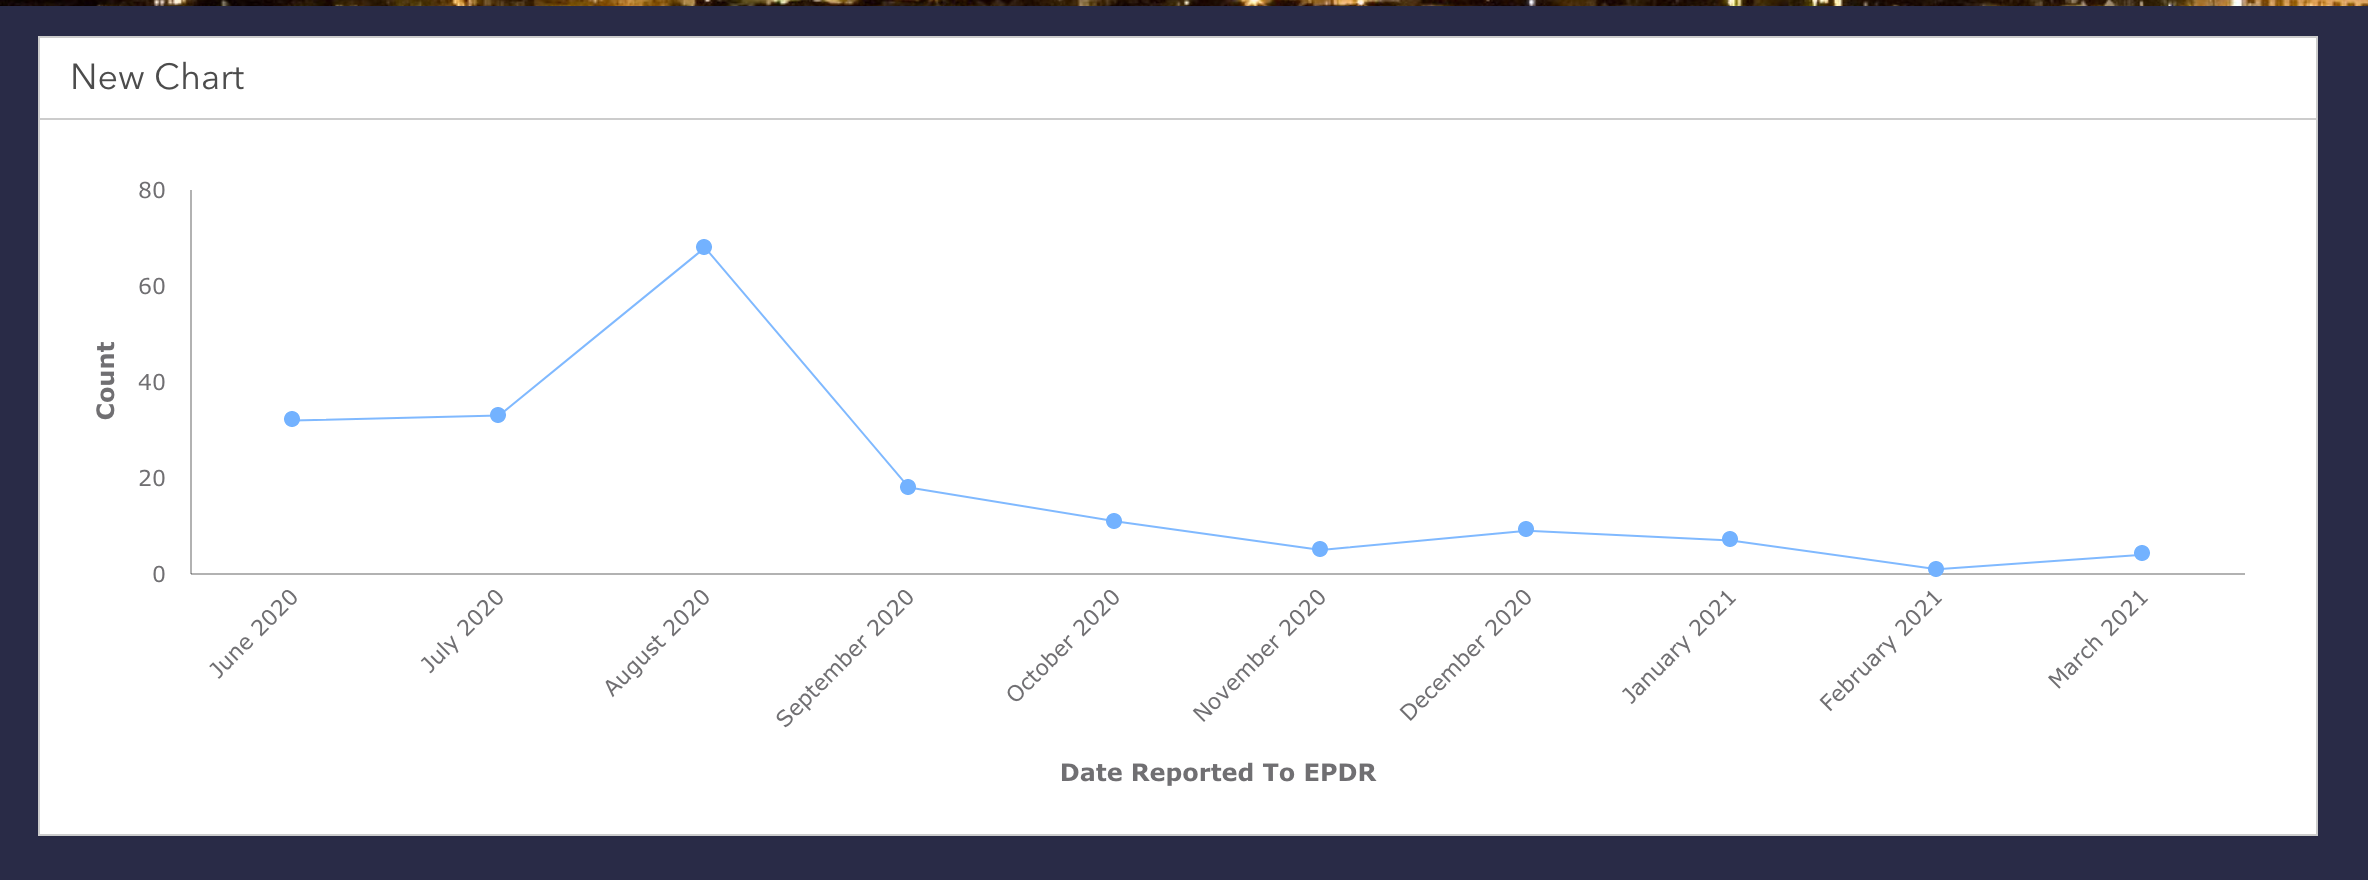
when doing a line graph with a chart card, the months that are being displayed are not correct. For example my date 6/2/2020 is being counted as May on the chart. Was wondering if this is a common issue as i dont think it in correct in my layer feeding the chart. In the picture May is displaying 32, but those should actually be for June. 
- Mark as New
- Bookmark
- Subscribe
- Mute
- Subscribe to RSS Feed
- Permalink
- Report Inappropriate Content
is it possible for us to take a look at this chart? is it public? we'll take a look in the meantime at some of our own datasets
- Mark as New
- Bookmark
- Subscribe
- Mute
- Subscribe to RSS Feed
- Permalink
- Report Inappropriate Content
I just made the hub public. https://chcq-emergency-preparedness-disaster-response-cdphdata.hub.arcgis.com/edit
Let me know if you don’t have access.
Essentially the chart is reading June Data as May, July Data as June etc. .
The chart is going to this layer https://cdphdata.maps.arcgis.com/home/item.html?id=e9351f3a3ee447bea807b5854032ff72#overview
Thanks!
- Mark as New
- Bookmark
- Subscribe
- Mute
- Subscribe to RSS Feed
- Permalink
- Report Inappropriate Content
We're able to reproduce this on our end and are looking into a fix. Thanks for your patience!
- Mark as New
- Bookmark
- Subscribe
- Mute
- Subscribe to RSS Feed
- Permalink
- Report Inappropriate Content
Apologies for the delay, but this has been fixed with this weeks release. Please let us know if you observe other issues with the chart card!