- Home
- :
- All Communities
- :
- Products
- :
- ArcGIS GeoStatistical Analyst
- :
- ArcGIS GeoStatistical Analyst Questions
- :
- Re: WGS 1984 Web Mercator Auxiliary Sphere & Geost...
- Subscribe to RSS Feed
- Mark Topic as New
- Mark Topic as Read
- Float this Topic for Current User
- Bookmark
- Subscribe
- Mute
- Printer Friendly Page
WGS 1984 Web Mercator Auxiliary Sphere & Geostatistical Analysis
- Mark as New
- Bookmark
- Subscribe
- Mute
- Subscribe to RSS Feed
- Permalink
- Report Inappropriate Content
Using the WGS 1984 Web Mercator Auxiliary Sphere coordinate system, how do I use the Geostatistical Analysis wizard to interpolate data from latitude and longitude points?
Solved! Go to Solution.
Accepted Solutions
- Mark as New
- Bookmark
- Subscribe
- Mute
- Subscribe to RSS Feed
- Permalink
- Report Inappropriate Content
For your csv/Excel data, you can use the Add XY Data tool: File menu, Add Data, Add XY Data. After you browse to the file and select it, the tool will default the coordinate system to that of the maps. You probably instead want to override that and choose Geographic Coordinate System, North America, NAD 1983 (or North American 1983 depending on ArcGIS version).
Once the XY layer is created, you can right-click the layer and choose data, export data. In that tool, you can write the data out to a feature class, or a shapefile. There's an option to use the data's coordinate system (NAD 1983) or use the data frame's coordinate system.
To set the data frame's coordinate system to NAD 1983 UTM 18 North, choose projected coordinate system, UTM, NAD 1983. Or in the search box, type in 26918, which should select it for you.
Melita
- Mark as New
- Bookmark
- Subscribe
- Mute
- Subscribe to RSS Feed
- Permalink
- Report Inappropriate Content
Unless you are covering a large area, why are you using that coordinate system? In any event, you should project the data using an appropriate projection for your area. For 6 degree latitudinal widths, a UTM fits most bills, or Lambert Conformal Conic for larger EW extents.
- Mark as New
- Bookmark
- Subscribe
- Mute
- Subscribe to RSS Feed
- Permalink
- Report Inappropriate Content
I guess it depends on what you mean by large area, state of NY, but I wanted this because the map looks better, in my opinion, as it does not make my shape file look flattened.
I'm new to this, so you will have to explain what you mean as I don't understand.
- Mark as New
- Bookmark
- Subscribe
- Mute
- Subscribe to RSS Feed
- Permalink
- Report Inappropriate Content
Carter, this link provided by New York State cites several data sources as well as the coordinate system/projection that the data are available in. In a pinch use UTM Zone 18 (Data Management Tools, Projections and Transformations, Project tool NOT the define projection tool) and make it so since NY is 'mostly' in UTM zone 18. There are other state plane systems for NY, which are more accurate but their geographic is limited to a smaller area. So have a look at the link
- Mark as New
- Bookmark
- Subscribe
- Mute
- Subscribe to RSS Feed
- Permalink
- Report Inappropriate Content
carter,
Not quite clear on ‘to interpolate data from latitude and longitude points’.
Nevertheless, I assume that you want to spatially interpolate data from sparse points in geodetic coordinates (Long, Lat), for example, air pollution or soil moistures, etc.
If so, your measurements’ interpolation by Geostatistics technique can be done spatially in any projected or geodetic coordinate systems like local, UTM or WGS 1984 Web Mercator Auxiliary Sphere. To decide which coordinate
system to use, it fully relies on the area and project you are working on (affecting your mapping accuracy only).
- For Long & Lat in ArcMap, pls refer to https://stuff.mit.edu/afs/athena/course/1/1.966/www/Lab4/
Secondly, if you want to make your interpolation successful, you are mostly required to ‘properly’ model spatial relationship among your measurements first, before taking interpolation, especially, with variant Kriging.
- In practice, running the Wizard in GA (by using the default parameters) confuses users, in most cases. Personally, this app should put some constraints ...
- Pls refer to the workflow introduction at http://resources.arcgis.com/en/help/main/10.2/index.html#/The_geostatistical_workflow/00310000000200...
Thirdly, conduct the uncertainty analysis on your interpolation...
- Mark as New
- Bookmark
- Subscribe
- Mute
- Subscribe to RSS Feed
- Permalink
- Report Inappropriate Content
Have a look at Empirical Bayesian Kriging, which in 10,3, makes use of chordal distances if your data are in an unprojected coordinate system.
Or do your interpolation in an appropriate projected coordinate system and project the output to GCS, however, often the area is too large for this and that is why we introduced chordal distances.
-Steve
- Mark as New
- Bookmark
- Subscribe
- Mute
- Subscribe to RSS Feed
- Permalink
- Report Inappropriate Content
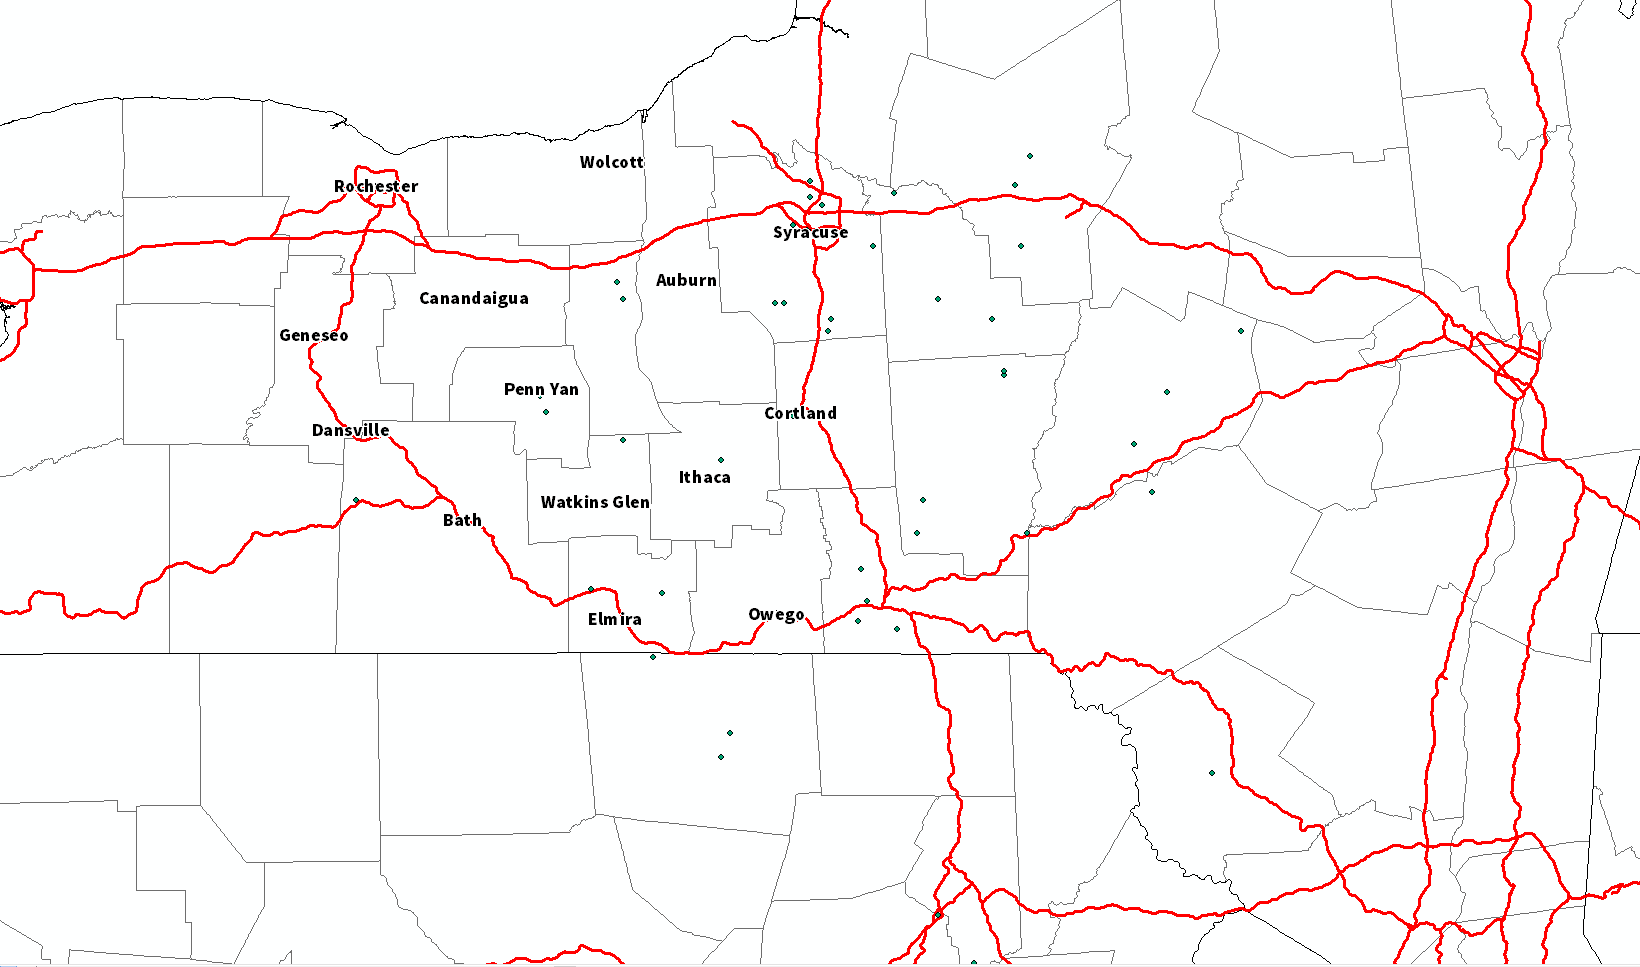
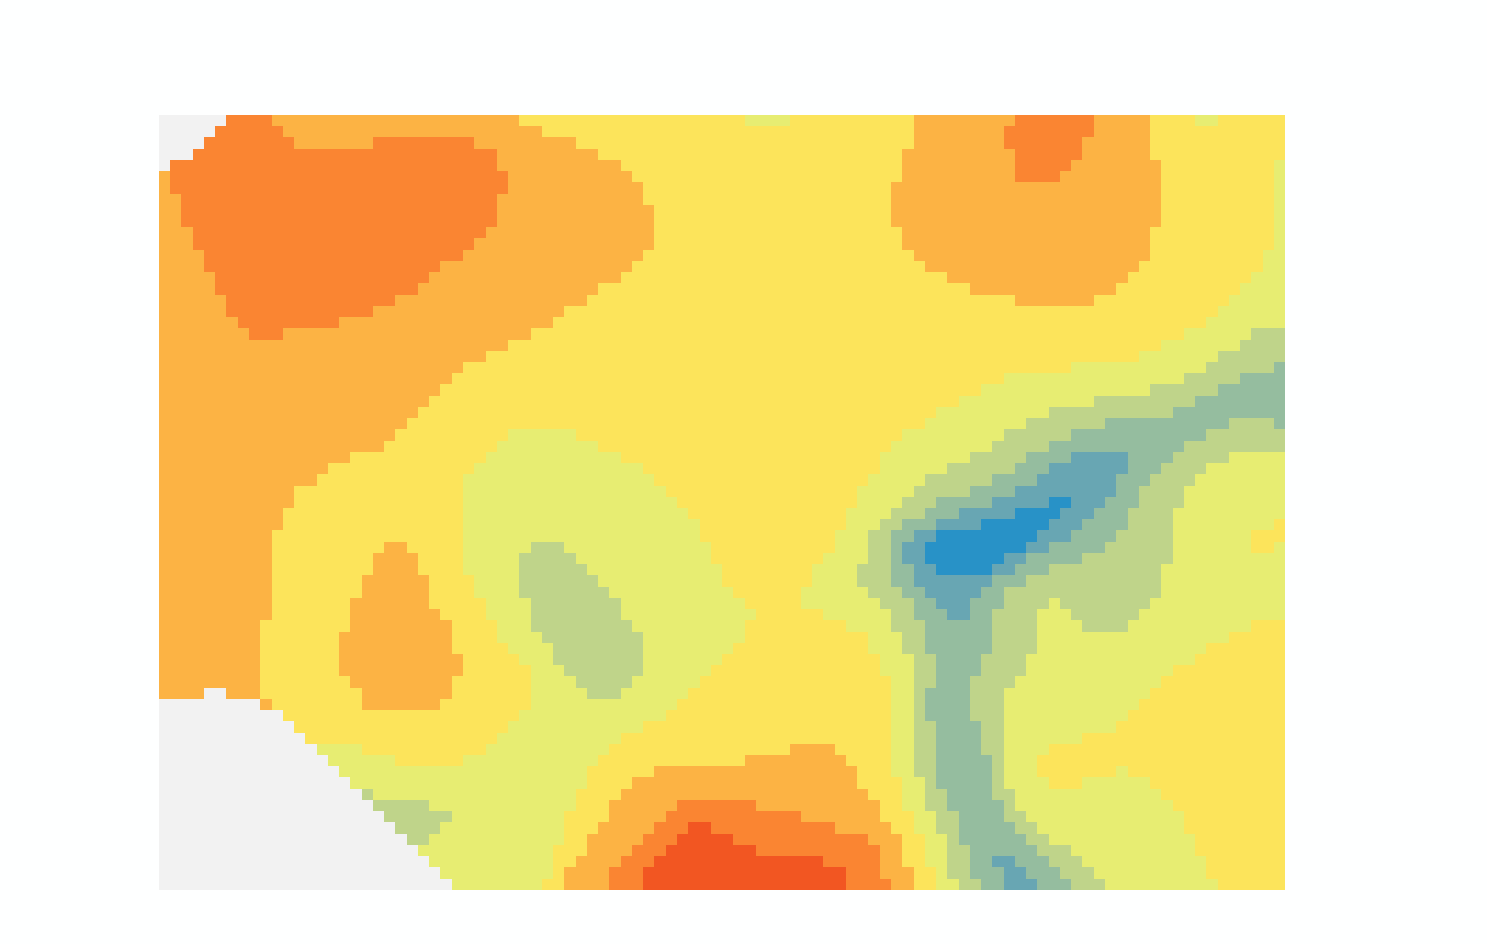
Ok let me explain this a bitter better. I can get it to plot the XY coordinates correctly (Image 1) but when I use the wizard to interpolate the data, the project ends up correct but in some other place really far away. (Image 2)
- Mark as New
- Bookmark
- Subscribe
- Mute
- Subscribe to RSS Feed
- Permalink
- Report Inappropriate Content
and if you right click the geostatistical layer, Properties->Source. What coordinate system is listed?
and then do the same for the input point feature class.
-Steve
- Mark as New
- Bookmark
- Subscribe
- Mute
- Subscribe to RSS Feed
- Permalink
- Report Inappropriate Content
This is all its says
| Data Type: | Text File |
| Location: | C:\Users\CarterHumphreys\Desktop |
| Dataset: | WindReports.csv |
| Data Field: | Data |
| Count: | 46 |
- Mark as New
- Bookmark
- Subscribe
- Mute
- Subscribe to RSS Feed
- Permalink
- Report Inappropriate Content
carter,
From your plot, it looks that your sparse data already are well distributed in the map. However, you are not satisified with your interpolation results (by the Wizard). Correct?
If so, as said, nice to put more effort on modeling spatial relation among your data (rather than coordinate system), before using the Wizard.
Honestly, on our expereince, the GA Wizard in ArcGIS offers an easy workflow for some of users. But, mostly it is not case, if only using parameters by default.
++++++++++
If your data are still not mapped into the map 'properly', because you don't know the exact coordinate system of coodinates in the data from the CSV file, you can attach and share here.