Turn on suggestions
Auto-suggest helps you quickly narrow down your search results by suggesting possible matches as you type.
Cancel
- Home
- :
- All Communities
- :
- Products
- :
- ArcGIS GeoStatistical Analyst
- :
- ArcGIS GeoStatistical Analyst Questions
- :
- Re: questions about cross-validation
Options
- Subscribe to RSS Feed
- Mark Topic as New
- Mark Topic as Read
- Float this Topic for Current User
- Bookmark
- Subscribe
- Mute
- Printer Friendly Page
questions about cross-validation
Subscribe
1559
13
10-05-2011 09:50 AM
10-05-2011
09:50 AM
- Mark as New
- Bookmark
- Subscribe
- Mute
- Subscribe to RSS Feed
- Permalink
- Report Inappropriate Content
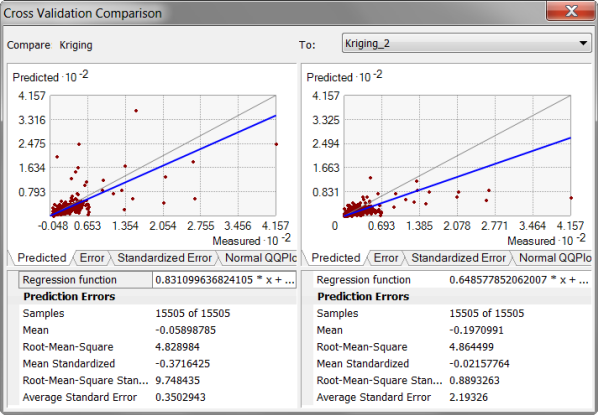
I have a question about the pic above.
Below is the original descriptions attached to this pic.
"For example, the root-mean-squared prediction error may be smaller for a particular model. Therefore, you might conclude that it is the optimal model. However, when comparing to another model, the root-mean-squared prediction error may be closer to the average estimated prediction standard error. This is a more valid model, because when you predict at a point without data, you have only the estimated standard errors to assess your uncertainty of that prediction. When the average estimated prediction standard errors are close to the root-mean-squared prediction errors from cross-validation, you can be confident that the prediction standard errors are appropriate. In the figure above, both kriging models are good, but those at the left are slightly better."
My question is, that, the ones with the root-mean-squared prediction errors closer to average standard errors should be the right one, instead of the left one. Why does it say that those at the left are slightly better? Thanks.
13 Replies
01-10-2013
11:35 AM
- Mark as New
- Bookmark
- Subscribe
- Mute
- Subscribe to RSS Feed
- Permalink
- Report Inappropriate Content
There's a typo in that pdf that I just noticed. For average standard error, the formula is missing a square. You can find the correct formulas here:
http://resources.arcgis.com/en/help/main/10.1/index.html#//00300000000z000000
"Average Standard Error" is the only formula that is different than you might expect. It might be better called "Root-Mean-Variance." We used this formula instead of a simple average because this formula is more directly comparable to the RMS.
Okay, I can see how they are similar. But would there be any reason to compare the "Average Standard Error" of a EBK model to RMSE of an IDW model, for example? It seems like looking at RMSE for both is a more defensible comparison.
Also, are there some common/likely reasons for seeing a RMS Standardized Prediction Error that is very large?
01-10-2013
12:58 PM
- Mark as New
- Bookmark
- Subscribe
- Mute
- Subscribe to RSS Feed
- Permalink
- Report Inappropriate Content
Yes, you would want to compare the RMSE between EBK and IDW.
A large root-mean-square-standardized usually indicates the model is unstable. The most common reason for this is because the Gaussian semivariogram is very unstable if the nugget is very small, compared to the sill. Note that Stable with parameter=2 and K-Bessel with parameter=10 both correspond to the Gaussian semivariogram (it's a special case of both).
EDIT: Oh, I understand what you were asking. It doesn't make much sense to compare RMS and average standard error from different models, but it is useful to compare them within the same model because if the difference between them is large, it indicates that the model may have problems.
01-14-2013
05:18 AM
- Mark as New
- Bookmark
- Subscribe
- Mute
- Subscribe to RSS Feed
- Permalink
- Report Inappropriate Content
Yes, you would want to compare the RMSE between EBK and IDW.
A large root-mean-square-standardized usually indicates the model is unstable. The most common reason for this is because the Gaussian semivariogram is very unstable if the nugget is very small, compared to the sill. Note that Stable with parameter=2 and K-Bessel with parameter=10 both correspond to the Gaussian semivariogram (it's a special case of both).
EDIT: Oh, I understand what you were asking. It doesn't make much sense to compare RMS and average standard error from different models, but it is useful to compare them within the same model because if the difference between them is large, it indicates that the model may have problems.
Thanks Eric. I think I've got enough of an understanding to move forward with my project.
06-20-2019
06:12 AM
- Mark as New
- Bookmark
- Subscribe
- Mute
- Subscribe to RSS Feed
- Permalink
- Report Inappropriate Content
Well, folks,
I have a similar query. What does the minus sign in the mean error and mean standardized error indicate? I mean, how does one interpret such a result?
Thanks
- « Previous
-
- 1
- 2
- Next »
- « Previous
-
- 1
- 2
- Next »