ArcGIS GeoEvent Server Blog - Page 2

cancel
Showing results for 
Show  only  | Search instead for 
Did you mean: 

Latest Activity

(106 Posts)
EricIronside
Esri Regular Contributor

Choice elements are configurable elements of GeoEvent Services that behave like Filter elements. However, unlike Filter elements, choice elements route event records to more than one destination based on an ordered list of filter operations called ‘when’ clauses. These conditional statements are applied to the event records in the order in which they are configured, much like an if-else statement in programming languages. In addition to the when clauses, an optional final route can be defined for events that do not pass the list of specified conditional statements.

Read more...

more
2 0 1,072
EricIronside
Esri Regular Contributor

ArcGIS GeoEvent Server 10.9 offers many new and exciting improvements in usability, expanded analytic capabilities, and stability enhancements. At a high-level, the user experience for designing and maintaining all of your real-time event processing workflows has been greatly simplified. In addition, several stability enhancements were made to increase event throughputs and uptime.

Read more...

more
3 2 1,193
RJSunderman
Esri Regular Contributor

In this blog we will take a deeper look at registering server connections with GeoEvent Server, something administrators commonly have to do to when configuring a GeoEvent Server deployment. 

Why do you have to register an ArcGIS Server connection with GeoEvent Server

There are several different configurable components which require you to select a registered server and specify which services folder, map/feature service, and often a specific feature layer exposed by that service in order to use the feature layer's schema or feature records. A few examples include:

All of the user-interfaces in the above examples populate their options from a cache of information GeoEvent Server collects when it queries a registered ArcGIS Server to discover published feature services. Service discovery is not performed the moment you click to open the panel. The cache is created and updated in the background because it can take several seconds – sometimes minutes or even tens of minutes – for GeoEvent Server to completely crawl the ArcGIS Server's REST Services Directory and query the information it needs from all of the available services.

Which leads into the topic I want to address in this blog:  Is there a way to know when service discovery is being run and how long it is expected to take?

Using the ArcGIS Server Connection component to log messages  

You can configure the following component logger to request DEBUG messages be logged:

com.esri.ges.datastore.agsconnection.DefaultArcGISServerConnection

I've included a sample of the logged messages you will be looking for at the end of this article. Requesting this component logger include DEBUG messages in its logging will allow you to see, in the system log file, when the service discovery kicks off and which map/feature services it interrogates to learn about their layers. A message will be logged for every feature service being interrogated as well as a success message when service discovery is complete. There is no indication in the GeoEvent Manager web application that service discovery is about to start or is currently running. The best way to tell that service discovery is running is to start the workflow to import a GeoEvent Definition. If the blue/white indicator displays, requesting you "please wait", you know that the GeoEvent Server is busy updating its ArcGIS Services cache. Otherwise the GeoEvent Definition user-interface will display immediately allowing you to choose a server connection, folder, feature service, and feature layer.

GeoEvent Manager does not allow you to configure, or schedule, when service discovery should take place. You are able to change the Discovery Rate for each server connection you register to specify how frequently a refresh should be performed. The default for recent software releases is every 60 minutes. I have personally found that when I use ArcGIS Pro, the Enterprise portal, or GeoEvent Manager to publish a new feature service, I want to use it now – so it is not uncommon for me to publish a feature service and immediately request GeoEvent Server run a service discovery to update its cache by clicking the refresh button on the server connection I have registered as a Data Store. This eliminates the need to have GeoEvent Server periodically refresh the cache for me, so I usually set the Discovery Rate for server connections I register to a fairly large value like 1440 minutes so that service discovery is run once once per day (or when GeoEvent Server is stopped and restarted).

Service discovery takes too long and interferes with normal operations. Is there anything I can do?

This is something the product team is working on. Refactoring GeoEvent Server to support all of the operations which use feature services, however, to interface with ArcGIS Server some other way is both high risk and high reward. Several different design options have been considered, but implementation has had to be deferred for each of the last several major releases. The best option for now, therefore, is to limit the number of features services which are discoverable each time service discovery is run.

A recommended best practice is to configure your GeoEvent Server Data Store (e.g. the server connection you are registering with GeoEvent Server) with credentials. The user credentials do not have to be an administrative user, just a user who owns and published the feature service. You can use the Enterprise portal content item manager to assign existing feature services a new owner and configure GeoEvent Server to authenticate as that user when crawling the ArcGIS Server's REST Services Directory to limit the number of discoverable services. GeoEvent Server administrators often configure their registered server connections with the ArcGIS Server or Enterprise portal primary administrative account – which naturally sees all published services.

If you can identify the feature services to which you want GeoEvent Server to write data, or from which you want GeoEvent Server to retrieve feature records or a feature layer's schema, and assign ownership of just those services to a user set aside specifically for your "real-time" data, you can improve service discovery considerably by not crawling all of the feature services being maintained by more traditional feature editing workflows. The trick is to identify the feature services your GeoEvent Server components actually care about and limit discovery to only those feature services.

Example messages logged by the ArcGIS Server Connection component logger

2020-11-05T13:55:02,124 | DEBUG | Public_Esri_Hosted_Server-Updater | DefaultArcGISServerConnection    | 56 - com.esri.ges.framework.datastore.agsconnection-datastore - 10.8.1 | sleep interrupted
java.lang.InterruptedException: sleep interrupted
        at java.lang.Thread.sleep(Native Method) ~[?:?]
        at com.esri.ges.datastore.agsconnection.DefaultArcGISServerConnection$CacheUpdater.run
(DefaultArcGISServerConnection.java:235) [56:com.esri.ges.framework.datastore.agsconnection-datastore:10.8.1]
2020-11-05T13:55:02,124 | DEBUG | Public_Esri_Hosted_Server-Updater | DefaultArcGISServerConnection    | 56 - com.esri.ges.framework.datastore.agsconnection-datastore - 10.8.1 | Exiting Cache Updater run method....
2020-11-05T13:55:03,274 | DEBUG | qtp808353329-598 | DefaultArcGISServerConnection    | 56 - com.esri.ges.framework.datastore.agsconnection-datastore - 10.8.1 | Create an instance of CacheUpdater....
2020-11-05T13:55:03,274 | DEBUG | Public_Esri_Hosted_Server-Updater | DefaultArcGISServerConnection    | 56 - com.esri.ges.framework.datastore.agsconnection-datastore - 10.8.1 | Updating cache for DataStore Public_Esri_Hosted_Server...
2020-11-05T13:55:08,944 | DEBUG | Public_Esri_Hosted_Server-Updater | DefaultArcGISServerConnection    | 56 - com.esri.ges.framework.datastore.agsconnection-datastore - 10.8.1 | Updating layers for Service (Folder: "/", Name: "Active_Hurricanes_Sampler", Type: "FeatureServer").
2020-11-05T13:55:15,296 | DEBUG | Public_Esri_Hosted_Server-Updater | DefaultArcGISServerConnection    | 56 - com.esri.ges.framework.datastore.agsconnection-datastore - 10.8.1 | Updating layers for Service (Folder: "/", Name: "Active_Hurricanes_v1", Type: "FeatureServer").
2020-11-05T13:55:21,613 | DEBUG | Public_Esri_Hosted_Server-Updater | DefaultArcGISServerConnection    | 56 - com.esri.ges.framework.datastore.agsconnection-datastore - 10.8.1 | Updating layers for Service (Folder: "/", Name: "Air_Quality_PM25_Latest_Results", Type: "FeatureServer").
2020-11-05T13:55:23,311 | DEBUG | Public_Esri_Hosted_Server-Updater | DefaultArcGISServerConnection    | 56 - com.esri.ges.framework.datastore.agsconnection-datastore - 10.8.1 | Updating layers for Service (Folder: "/", Name: "ASAM_events_V1", Type: "FeatureServer").
2020-11-05T13:55:25,033 | DEBUG | Public_Esri_Hosted_Server-Updater | DefaultArcGISServerConnection    | 56 - com.esri.ges.framework.datastore.agsconnection-datastore - 10.8.1 | Updating layers for Service (Folder: "/", Name: "Coral_Reef_Stations", Type: "FeatureServer").
2020-11-05T13:55:27,876 | DEBUG | Public_Esri_Hosted_Server-Updater | DefaultArcGISServerConnection    | 56 - com.esri.ges.framework.datastore.agsconnection-datastore - 10.8.1 | Updating layers for Service (Folder: "/", Name: "GDELT_Health_Pandemic", Type: "FeatureServer").
2020-11-05T13:55:29,170 | DEBUG | Public_Esri_Hosted_Server-Updater | DefaultArcGISServerConnection    | 56 - com.esri.ges.framework.datastore.agsconnection-datastore - 10.8.1 | Updating layers for Service (Folder: "/", Name: "GDELT_v1_Social_Tones", Type: "FeatureServer").
2020-11-05T13:55:30,368 | DEBUG | Public_Esri_Hosted_Server-Updater | DefaultArcGISServerConnection    | 56 - com.esri.ges.framework.datastore.agsconnection-datastore - 10.8.1 | Updating layers for Service (Folder: "/", Name: "IHME_Projected_Peaks_QA", Type: "FeatureServer").
2020-11-05T13:55:31,995 | DEBUG | Public_Esri_Hosted_Server-Updater | DefaultArcGISServerConnection    | 56 - com.esri.ges.framework.datastore.agsconnection-datastore - 10.8.1 | Updating layers for Service (Folder: "/", Name: "Median_Sea_Ice_Extent_for_the_Antarctic", Type: "FeatureServer").
2020-11-05T13:55:32,995 | DEBUG | Public_Esri_Hosted_Server-Updater | DefaultArcGISServerConnection    | 56 - com.esri.ges.framework.datastore.agsconnection-datastore - 10.8.1 | Updating layers for Service (Folder: "/", Name: "Median_Sea_Ice_Extent_for_the_Arctic", Type: "FeatureServer").
2020-11-05T13:55:34,063 | DEBUG | Public_Esri_Hosted_Server-Updater | DefaultArcGISServerConnection    | 56 - com.esri.ges.framework.datastore.agsconnection-datastore - 10.8.1 | Updating layers for Service (Folder: "/", Name: "MODIS_Thermal_v1", Type: "FeatureServer").
2020-11-05T13:55:35,225 | DEBUG | Public_Esri_Hosted_Server-Updater | DefaultArcGISServerConnection    | 56 - com.esri.ges.framework.datastore.agsconnection-datastore - 10.8.1 | Updating layers for Service (Folder: "/", Name: "National_Farmers_Market_Directory", Type: "FeatureServer").
2020-11-05T13:55:36,445 | DEBUG | Public_Esri_Hosted_Server-Updater | DefaultArcGISServerConnection    | 56 - com.esri.ges.framework.datastore.agsconnection-datastore - 10.8.1 | Updating layers for Service (Folder: "/", Name: "ncov_cases", Type: "FeatureServer").
2020-11-05T13:55:38,421 | DEBUG | Public_Esri_Hosted_Server-Updater | DefaultArcGISServerConnection    | 56 - com.esri.ges.framework.datastore.agsconnection-datastore - 10.8.1 | Updating layers for Service (Folder: "/", Name: "NDFD_Ice_v1", Type: "FeatureServer").
2020-11-05T13:55:40,579 | DEBUG | Public_Esri_Hosted_Server-Updater | DefaultArcGISServerConnection    | 56 - com.esri.ges.framework.datastore.agsconnection-datastore - 10.8.1 | Updating layers for Service (Folder: "/", Name: "NDFD_Precipitation_v1", Type: "FeatureServer").
2020-11-05T13:55:43,479 | DEBUG | Public_Esri_Hosted_Server-Updater | DefaultArcGISServerConnection    | 56 - com.esri.ges.framework.datastore.agsconnection-datastore - 10.8.1 | Updating layers for Service (Folder: "/", Name: "NDFD_SnowFall_v1", Type: "FeatureServer").
2020-11-05T13:55:45,920 | DEBUG | Public_Esri_Hosted_Server-Updater | DefaultArcGISServerConnection    | 56 - com.esri.ges.framework.datastore.agsconnection-datastore - 10.8.1 | Updating layers for Service (Folder: "/", Name: "NDFD_WindForecast_v1", Type: "FeatureServer").
2020-11-05T13:55:49,935 | DEBUG | Public_Esri_Hosted_Server-Updater | DefaultArcGISServerConnection    | 56 - com.esri.ges.framework.datastore.agsconnection-datastore - 10.8.1 | Updating layers for Service (Folder: "/", Name: "NDFD_WindGust_v1", Type: "FeatureServer").
2020-11-05T13:55:51,519 | DEBUG | Public_Esri_Hosted_Server-Updater | DefaultArcGISServerConnection    | 56 - com.esri.ges.framework.datastore.agsconnection-datastore - 10.8.1 | Updating layers for Service (Folder: "/", Name: "NDFD_WindSpeed_v1", Type: "FeatureServer").
2020-11-05T13:55:53,124 | DEBUG | Public_Esri_Hosted_Server-Updater | DefaultArcGISServerConnection    | 56 - com.esri.ges.framework.datastore.agsconnection-datastore - 10.8.1 | Updating layers for Service (Folder: "/", Name: "NDGD_SmokeForecast_v1", Type: "FeatureServer").
2020-11-05T13:55:54,193 | DEBUG | Public_Esri_Hosted_Server-Updater | DefaultArcGISServerConnection    | 56 - com.esri.ges.framework.datastore.agsconnection-datastore - 10.8.1 | Updating layers for Service (Folder: "/", Name: "NOAA_METAR_current_wind_speed_direction_v1", Type: "FeatureServer").
2020-11-05T13:55:55,683 | DEBUG | Public_Esri_Hosted_Server-Updater | DefaultArcGISServerConnection    | 56 - com.esri.ges.framework.datastore.agsconnection-datastore - 10.8.1 | Updating layers for Service (Folder: "/", Name: "NOAA_short_term_warnings_v1", Type: "FeatureServer").
2020-11-05T13:55:58,401 | DEBUG | Public_Esri_Hosted_Server-Updater | DefaultArcGISServerConnection    | 56 - com.esri.ges.framework.datastore.agsconnection-datastore - 10.8.1 | Updating layers for Service (Folder: "/", Name: "NOAA_storm_reports_Sampler", Type: "FeatureServer").
2020-11-05T13:56:00,844 | DEBUG | Public_Esri_Hosted_Server-Updater | DefaultArcGISServerConnection    | 56 - com.esri.ges.framework.datastore.agsconnection-datastore - 10.8.1 | Updating layers for Service (Folder: "/", Name: "NOAA_storm_reports_v1", Type: "FeatureServer").
2020-11-05T13:56:06,494 | DEBUG | Public_Esri_Hosted_Server-Updater | DefaultArcGISServerConnection    | 56 - com.esri.ges.framework.datastore.agsconnection-datastore - 10.8.1 | Updating layers for Service (Folder: "/", Name: "NWS_Watches_Warnings_Sampler", Type: "FeatureServer").
2020-11-05T13:56:12,942 | DEBUG | Public_Esri_Hosted_Server-Updater | DefaultArcGISServerConnection    | 56 - com.esri.ges.framework.datastore.agsconnection-datastore - 10.8.1 | Updating layers for Service (Folder: "/", Name: "NWS_Watches_Warnings_v1", Type: "FeatureServer").
2020-11-05T13:56:19,622 | DEBUG | Public_Esri_Hosted_Server-Updater | DefaultArcGISServerConnection    | 56 - com.esri.ges.framework.datastore.agsconnection-datastore - 10.8.1 | Updating layers for Service (Folder: "/", Name: "Recent_Hurricanes_v1", Type: "FeatureServer").
2020-11-05T13:56:21,726 | DEBUG | Public_Esri_Hosted_Server-Updater | DefaultArcGISServerConnection    | 56 - com.esri.ges.framework.datastore.agsconnection-datastore - 10.8.1 | Updating layers for Service (Folder: "/", Name: "Satellite_VIIRS_Thermal_Hotspots_and_Fire_Activity", Type: "FeatureServer").
2020-11-05T13:56:22,871 | DEBUG | Public_Esri_Hosted_Server-Updater | DefaultArcGISServerConnection    | 56 - com.esri.ges.framework.datastore.agsconnection-datastore - 10.8.1 | Updating layers for Service (Folder: "/", Name: "seaice_extent_N_v1", Type: "FeatureServer").
2020-11-05T13:56:23,976 | DEBUG | Public_Esri_Hosted_Server-Updater | DefaultArcGISServerConnection    | 56 - com.esri.ges.framework.datastore.agsconnection-datastore - 10.8.1 | Updating layers for Service (Folder: "/", Name: "seaice_extent_S_v1", Type: "FeatureServer").
2020-11-05T13:56:25,081 | DEBUG | Public_Esri_Hosted_Server-Updater | DefaultArcGISServerConnection    | 56 - com.esri.ges.framework.datastore.agsconnection-datastore - 10.8.1 | Updating layers for Service (Folder: "/", Name: "SPI_recent", Type: "FeatureServer").
2020-11-05T13:56:28,250 | DEBUG | Public_Esri_Hosted_Server-Updater | DefaultArcGISServerConnection    | 56 - com.esri.ges.framework.datastore.agsconnection-datastore - 10.8.1 | Updating layers for Service (Folder: "/", Name: "Standardized_Precipitation_Index_(SPI)", Type: "FeatureServer").
2020-11-05T13:56:31,492 | DEBUG | Public_Esri_Hosted_Server-Updater | DefaultArcGISServerConnection    | 56 - com.esri.ges.framework.datastore.agsconnection-datastore - 10.8.1 | Updating layers for Service (Folder: "/", Name: "US_Cases_per_county_(time)", Type: "FeatureServer").
2020-11-05T13:56:33,073 | DEBUG | Public_Esri_Hosted_Server-Updater | DefaultArcGISServerConnection    | 56 - com.esri.ges.framework.datastore.agsconnection-datastore - 10.8.1 | Updating layers for Service (Folder: "/", Name: "USA_Wildfires_v1", Type: "FeatureServer").
2020-11-05T13:56:35,074 | DEBUG | Public_Esri_Hosted_Server-Updater | DefaultArcGISServerConnection    | 56 - com.esri.ges.framework.datastore.agsconnection-datastore - 10.8.1 | Updating layers for Service (Folder: "/", Name: "USGS_Seismic_Data_v1", Type: "FeatureServer").
2020-11-05T13:56:36,595 | DEBUG | Public_Esri_Hosted_Server-Updater | DefaultArcGISServerConnection    | 56 - com.esri.ges.framework.datastore.agsconnection-datastore - 10.8.1 | Updating cache for DataStore Public_Esri_Hosted_Server done. Success: true.‍‍‍‍‍‍‍‍‍‍‍‍‍‍‍‍‍‍‍‍‍‍‍‍‍‍‍‍‍‍‍‍‍‍‍‍‍‍‍‍‍‍‍‍‍‍‍‍‍‍‍‍‍‍‍‍‍‍‍‍‍‍‍‍‍‍‍‍‍‍‍‍‍‍‍‍‍‍‍‍‍‍‍‍‍‍‍‍‍‍‍‍‍‍‍‍‍‍‍‍‍‍‍‍‍‍‍‍‍‍‍‍‍‍‍‍‍‍‍‍‍‍‍‍‍‍‍‍‍‍‍‍‍‍‍‍‍‍‍‍‍‍‍‍‍‍‍‍‍‍‍‍‍‍‍‍‍‍‍‍‍‍‍‍‍‍‍‍‍‍‍‍‍‍‍‍‍‍‍‍‍‍‍‍‍‍‍‍‍‍‍‍‍‍‍‍‍‍‍‍‍‍‍‍‍‍‍‍‍‍‍‍‍‍‍‍‍‍‍‍‍‍‍‍‍‍‍‍‍‍‍‍‍‍‍‍‍‍‍‍‍‍‍‍‍‍‍‍‍‍‍‍‍‍‍‍‍‍‍‍‍‍‍‍‍‍‍‍‍‍‍‍‍‍‍‍‍‍‍‍‍‍‍‍‍‍‍‍‍‍‍‍‍‍‍‍‍‍‍‍‍‍‍‍‍‍‍‍‍‍‍‍‍‍‍‍‍‍‍‍‍‍‍‍‍‍‍‍‍‍‍‍‍‍‍‍‍‍‍‍‍‍‍‍‍‍‍‍‍‍‍‍‍‍‍‍‍‍‍‍‍‍‍‍‍‍‍‍‍‍‍‍‍‍‍‍‍‍‍‍‍‍‍‍‍‍‍‍‍‍‍‍‍‍‍‍

You can see from the above that discovery of 36 feature services hosted by an external, public server, took just over 90 seconds. The more services there are to discover, the longer service discovery will take.

 
See Also:

more
6 0 1,589
EricIronside
Esri Regular Contributor

These days, the preferred method for monitoring a GeoEvent Server in a production system is the ArcGIS Monitor. But sometimes you want to just see/monitor the local system directly within GeoEvent to quickly evaluate how the system is performing (or alert you if it isn't performing well).  Below are instructions for deploying an input connector that will collect some basic information from your system and output it to a csv file.  You are free to modify the configuration once imported to write the data to a geodatabase and/or alert when certain parameters exceed certain tolerances.

Import the System Info Transport

Unzip the attached zip file below to a temporary location. You will deploy the new System Info Transport to your GeoEvent server.

Method 1: Copy to the deploy folder

Copy the .jar file from the temporary location into your GeoEvent Deploy directory. On Windows the default location for the deploy directory is:

c:\Program Files\arcgis\server\geoevent\deploy\ ).

Method 2: Import the .jar file using GeoEvent Manager

In GeoEvent Manager, navigate to Site > Components > Transports and press the Add Local Transport button. Press the Choose Files button, browse to the temporary location, select the .jar file, press Open, then press the Add button. Once the System Info Transport is deployed it will show up in your list of inbound transports within GeoEvent Manager on the Site > Components > Transports page (you may have to refresh the page).

Import the configuration

In GeoEvent Manager navigate to Site > GeoEvent > Configuration Store and press the Import Configuration button. Press the Choose File button, browse to the location of the GeoEventConfig SystemInfo.xml file, press the Open button, then press the Next button. Select Import Configuration and press the Import button. This will import the System Info Connector, GeoEvent Definition, Input, Output, and Geoevent Service for you.

Explore the connector

Navigate to Site > GeoEvent > Connectors  The connector utilizes the System Info Transport, which generates information in generic JSON format. The adapter is the Generic JSON Adapter. The following fields are hidden from the user since they are not used: Expected Date Format, Construct Geometry from Fields, X/Y/Z Geometry field, Default Spatial Reference, Learning Mode, As GeoJSON, and JSON Object Name. Note that the JSON Object Name is first default hard coded to ‘OperatingSystemInformation’.

The remaining fields can be left in the Shown Properties area. You may wish to modify the Update Interval, since the default value (1 second) may be too frequent for long term monitoring.

Explore the GeoEvent Definition

A default system-info-in GeoEvent Definition is supplied in the configuration with some basic parameters. You may wish to have the input re-generate a new GeoEvent Definition for you just to be sure that the properties reported on your system are the same. To do this, follow the steps below:

  1. Rename the system-info-in GeoEvent definition to something like system-into-in-orignal.
  2. Navigate to Services > Inputs > system-info and make the following change and save the input:
    1. Create GeoEvent Definition: Yes
    2. GeoEvent Definition Name (New): system-info-in-auto
  3. Run the input until at least one event is received, then turn the input off.
  4. Navigate to Site > GeoEvent > GeoEvent Definitions and make a copy of the site-info-in-auto GeoEvent Definition.
    1. Name the copy: site-info-in
    2. Save the copy
  5. Navigate back to Services > Inputs > system-info and make the following change and save the input:
    1. Create GeoEvent Definition: No
    2. GeoEvent Definition Name (Existing): system-info-in
  6. At this point you can delete the system-info-in-auto and system-info-in-original GeoEvent Definitions, since they are no longer used.

Explore the GeoEvent Service

The GeoEvent Service system-info using the system-info input to generate a system-info-in event every 60 seconds. These events are written directly to an output that writes the events to a csv file in the GeoEvent Backup folder.

By default this folder (on Windows) is located:

C:\ProgramData\Esri\GeoEvent\systeminfo\


These csv files will record the status of your server over time and can be easily manipulated in Excel to create graphs of the historical system resources. 

more
1 3 884
EricIronside
Esri Regular Contributor

With the 2020 Esri UC coming up next week I wanted to highlight what Esri and the larger GIS community are doing this year to promote Diversity, Equity & Racial Justice. I believe that everyone should step up and participate in these activities. 


Click the links below to see what is going on and how you can get involved:

more
0 0 411
EricIronside
Esri Regular Contributor

With the 2020 Esri UC coming up next week I wanted to highlight the ability to schedule appointments with experts to get your questions answered, your designs reviewed, or whatever it is that you feel may need a review by an expert.  

Click the link below to schedule your appointment today:

UC/Experience/ArcGIS-Appointments

more
1 1 612
EricIronside
Esri Regular Contributor

When writing a custom component for GeoEvent using the GeoEvent SDK, it is sometimes helpful to cache some information to the file system. This information could be a cache of the most recent data or configuration properties. This blog shows you how to allocate a folder within the GeoEvent file structure that will allow you create files and store data that will persist through GeoEvent Server restarts.

Step 1: OSGI Blueprint Configuration

The first step is to modify the config.xml file under your src/main/resources/OSGI-INF/blueprint/ folder.  You need to add the following property to your <bean>:

<property name="dataFolder" value="./data/yourfolder" />

For example:

<bean id="myTransportServiceBean" class="com.esri.geoevent.transport.example.MyTransportService" activation="eager">

<property name="bundleContext" ref="blueprintBundleContext" />
<property name="dataFolder" value="./data/mytransport" />

</bean>

The base directory is the install directory for GeoEvent Server (default on Windows is c:\Program Files\arcgis\server\geoevent\ ). Within the GeoEvent Server install folder there are two directories that are recommended for use:

  • ./data/: The data directory is a file cache of information such as OSGI bundles, logs, and other temporary files. The files in this folder are used for caching the state of GeoEvent Server between restarts.  If you are storing a cache of your custom component's data or configuration information, this is an ideal location.
  • ./assets/: The assets folder is a place where you can store information that will be available on the GeoEvent Server Manager's web server.  You can use this location to store any information that may potentially be accessed via a browser. This could be configuration information or a status page for your custom component.  Items in this folder can be accessed using the following URL: https://yourServerName:6143/geoevent/assets/

Step 2: Add a setDataFolder() method to your Service

After you make the config.xml file change above, OSGI will inject a folder location into your service bean.  Within your Service Java class, you need to add a setter method to allow the framework to inject this folder object.  Here's an example transport Service class:

public class MyTransportService extends TransportServiceBase {

protected static File dataFolder;
public MyTransportService() {

definition = new XmlTransportDefinition(getResourceAsStream("geotab-transport-definition.xml"));

}

public void setDataFolder(File inDataFolder) {

dataFolder = inDataFolder;
if (!dataFolder.exists()) {

dataFolder.mkdirs();

}

}

@Override
public Transport createTransport() throws ComponentException {

return new MyTransport(definition, dataFolder);

}

}

Step 3: Use the folder

After the above changes, your custom component will have access to a file folder location that can be used to store files.  As mentioned above, these files can contain configuration information, cached data, status information, or whatever you like.

more
0 0 480
EricIronside
Esri Regular Contributor

One common input for GeoEvent is to create a REST endpoint to receive XML, JSON, or CSV events.  Once created the URL is displayed on the input and is available for data providers to POST data to.  But some have wondered how you secure such an endpoint.  In general, this type of endpoint is relatively secure because it requires an attacker know two very specific things:

  1. The exact case-sensitive URL of the receiver endpoint.
  2. The GeoEvent definition that the receiver endpoint is listening for.

Current versions of GeoEvent exposed a directory of GeoEvent configurations, making it easier to discover this information.  When GeoEvent 10.8.1 is released, this will all change and the directory will be secured just like the /geoevent/admin/ API. 

This blog discusses one option for securing your receiver end points, regardless of version. These two steps are not foolproof, but do go a long way toward making your receiver endpoints as secure as possible.  

Step 1: Reverse Proxy

The first step is to obscure the endpoint behind a reverse proxy.  The proxy will translate an externally available HTTP URL on a standard port (80/443) to the internal URL on port 6143.  When communicating with external/3rd party data providers, you can give them the external URL and don't have to expose your internal network names.

Utilizing a reverse proxy also allows you to hide the directory information above so that external entities cannot browse your GeoEvent configuration.

Step 2: White List IPs

For the second step, you will need to know the IP addresses that your data provider will be POSTing data from. This could be a single IP or a range/set of IPs in cases where the data provider is using a cluster of servers or has fail-over/disaster recovery set up on their system.  Have your IT administration white list these IP addresses and block all other communication to the external URL.  Once this step is done, only the white listed IP addresses will be able to post data to your external receiver URL.

Step 3: Monitor

As with any good security system, your receiver endpoints must be monitored.  At a minimum be sure to periodically inspect the data that is received and compare it to known information you have about the event stream (like a separate API for querying data, equipment logs, or known operating parameters).  In addition, you could monitor event rates looking for situations where the number of events per period of time increases, indicating someone is injecting events or a denial of service attack.

more
1 0 934
EricIronside
Esri Regular Contributor

Complex Track Gap Requirements

I was recently asked to provide a solution that would identify the status of a set of devices.  Each device could be 'Active' or 'Inactive' based on the amount of time that had elapsed since the last message received.  On first glance this seemed like a good solution for the Track Gap Detector, however there was an additional detail in the requirements that threw that solution out the window: Each class of device had a different time window for active/inactive status (as shown below).

So for "Red" devices, they were sending events every 15 seconds and needed to be marked as inactive if more than 8 events (or 120 seconds) had been missed. But for "Pink" devices, they were sending events every 10 minutes and needed to be marked as inactive if more than 2 events (or 20 minutes) had been missed.

Complex Reporting Requirements

To make matters even harder, a report was needed that would indicate the number of each device that was active/inactive. This report needed to be accurate and updated in real-time.  GeoEvent can handle the real-time updates of singular events, but aggregation and caching of state is NOT something GeoEvent does (with the exception of a few operations like enter/exit).  

'Keep It Simple' Solution

I considered having a different Track Gap Detector for each group, but that wasn't sustainable if the list of devices was to grow.  I also considered writing some sort of custom processor to cache the state of each TRACK_ID and provide some sort of aggregate count of group status.  But then I came to my senses and realized there is one tool in our GIS arsenal that is expert at on the fly status calculations and aggregations: Database Views (or Query Layers if you prefer). 

A database view is created in a relational database (SQL Server Express in this instance) by ArcCatalog. You use SQL to define the view. Each view is based on an underlying database table (feature class) and is refreshed for each request. So you can use database views to do all sorts of wonderful things to your data that you can't do elsewhere.

Real-time Device Updates

To start, I used GeoEvent to write the latest updates from each of the devices to a feature class in the database. These records contained a lot of information from the device, but the most important fields for this blog are Name (TRACK_ID), Type (Group), and MsgDatetime (last time the device reported in). This feature class was stored in the same relational database as the configuration table above (I left out the threshold in seconds because it can be calculated).


This configuration table can easily be maintained or even expanded as more devices and/or new types of devices are added to the system. 

Real-time Device Status

Now for our first view.  To determine the status of any device, we need to compare the age of the last event record to the inactive threshold. In SQL Server, we can use the DATEDIFF function to subtract the message time from the current time. The result (in seconds) tells us how old each record is.

Age of Last Message = DATEDIFF( seconds, device.MsgDatetime, SYSUTCDATETIME() )

To calculate the inactive threshold in seconds, we multiply the report interval by the inactive threshold:

Inactive Threshold (seconds) = config.ReportInterval * config.Threshold

For the status, we need an CASE WHEN statement to see if the age (in seconds) is greater than or less than the inactive threshold (in seconds):

CASE
    WHEN (DATEDIFF(second, asset.MsgDatetime, SYSUTCDATETIME()) > (config.ReportInterval * config.Threshold)) 
  THEN 'Inactive'
  ELSE 'Active'
  END
AS AssetStatus

In order to join the two tables together, we use a LEFT OUTER JOIN. This type of join selects all the records of the first table, and joins a matching record from the second table.  We perform this join on the device's type.

FROM dbo.DEVICECURRENT AS device LEFT OUTER JOIN
 dbo.DEVICECONFIG AS config ON device.Type = config.DeviceType

The final view SQL is as follows and the result of the view is below that:

SELECT 
  device.OBJECTID, 
   device.Name, 
   device.DeviceType, 
   device.MsgDatetime, 
   config.ReportInterval, 
   config.Threshold,
   config.ReportInterval * config.Threshold AS MaxAgeSeconds, 
   DATEDIFF(second, device.MsgDatetime, SYSUTCDATETIME()) AS CurrentAge, 
   CASE
     WHEN (DATEDIFF(second, device.MsgDatetime, SYSUTCDATETIME()) > (config.ReportInterval * config.Threshold)) 
    THEN 'Inactive' 
    ELSE 'Active' 
    END 
  AS DeviceStatus, 
  device.SHAPE
FROM dbo.DEVICECURRENT AS device 
LEFT OUTER JOIN dbo.DEVICECONFIG AS config ON device.DeviceType = config.DeviceType

Group Status

Now we need to aggregate these individual status records into a group status.  To do that, we want to group above status view by the DeviceType and count how many records are in each type. 

GROUP BY DeviceType

But we don't just want a count, we need to know how many are active and how many are inactive.  In order to conditionally count records we can use the COALESCE function in SQL Server:

COALESCE (SUM(CASE WHEN AssetStatus = 'Active' THEN 1 ELSE 0 END), 'n/a') AS Active
COALESCE (SUM(CASE WHEN AssetStatus = 'Inactive' THEN 1 ELSE 0 END), 'n/a') AS Inactive

In order to aggregate the geometry of the group, I've chosen the convex hull operation provided by SQL Server:

geometry::ConvexHullAggregate(SHAPE) AS shape

So the final SQL that defines this view is as follows:

SELECT
  MIN(OBJECTID) AS OBJECTID,
  DeviceType,
  COALESCE (SUM(CASE WHEN DeviceStatus = 'Active' THEN 1 ELSE 0 END), 'n/a') AS Active,
  COALESCE (SUM(CASE WHEN DeviceStatus = 'Inactive' THEN 1 ELSE 0 END), 'n/a') AS Inactive,
  geometry::ConvexHullAggregate(SHAPE) AS SHAPE
FROM dbo.DeviceStatus
GROUP BY DeviceType

Which results in the following view table:

Publish the Views

Once I had the views working, I added them to a map service, created a web map and a dashboard to display each device's current location and status as well as the group status. All of that information updates in real-time based on each device's last event age.

more
1 0 822
EricIronside
Esri Regular Contributor


Updated to GeoEvent 10.6.1 on June 27, 2022.

Ingesting Variable Length CSV Messages

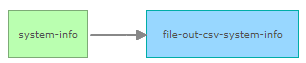
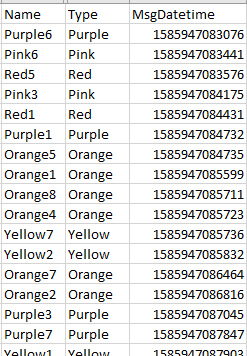
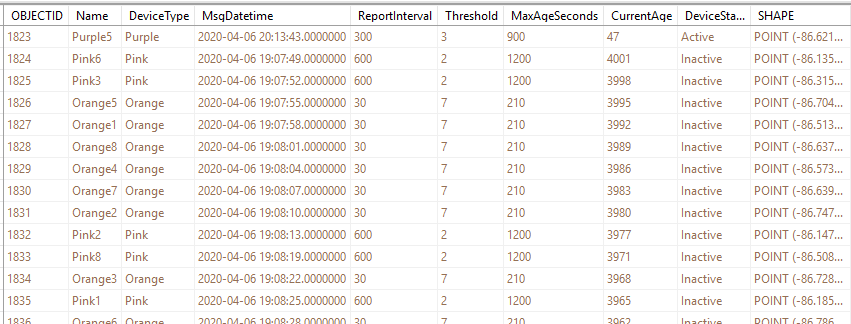
In GeoEvent, you can use a Text Adapter on an inbound connector to parse comma separated values (CSV), typically with either the TCP transport (like when you use the GeoEvent Simulator) or the File transport (to watch a folder for data files).  In general, these CSV messages tend to be static in format allowing you to use one GeoEvent definition to read them in.  However, I recently ran into a situation where a device was reporting a truncated message, based on the amount of data it actually had to report. In this case, the devices were only reporting updates, so if there was no update for fields at the end of the message, those fields were omitted from the CSV message.  A sample of the data would look like this (I've added some spaces to make the structure a bit clearer):


Name,IdNum,Type,MsgDatetime     ,Value1,Value2,Value3,Value4,Value5,Value6,Value7,Value8,Value9,Value10
Red1,1          ,Red ,1585947092133,           ,           ,           ,           ,           ,20.402,           ,           ,           ,-0.57
Red1,1          ,Red ,1585947692133,           ,           ,           ,           ,           ,1.5001,           ,148     ,2
Red1,1          ,Red ,1585948292133,           ,10       ,62       ,4         ,-0.22   ,17.701,170     ,           ,1
Red1,1          ,Red ,1585948892133,6         ,           ,65       ,           ,0.64    ,           ,220     ,           ,8
Red1,1          ,Red ,1585949492133,           ,           ,           ,1
Red1,1          ,Red ,1585950092133,94       ,15       ,           ,1         ,           ,           ,480     ,139     ,3
Red1,1          ,Red ,1585950692133,42       ,3         ,           ,           ,0.64    ,           ,           ,           ,4        ,-0.99
Red1,1          ,Red ,1585951292133,67       ,-17      ,           ,           ,-0.05  ,5.4005,            ,           ,          ,-0.74
Red1,1          ,Red ,1585951892133,           ,           ,15       ,3         ,-0.72  ,           ,280      ,           ,7
Red1,1          ,Red ,1585952492133,22       ,14       ,           ,           ,-0.33  ,28.502,            ,           ,8
Red1,1          ,Red ,1585953092133,           ,2         ,           ,1         ,          ,           ,395      ,           ,3
Red1,1          ,Red ,1585953692133,           ,           ,           ,1         ,           ,           ,           ,           ,4
Red1,1          ,Red ,1585954292133,55       ,3        ,20        ,           ,           ,           ,           ,           ,8
Red1,1          ,Red ,1585954892133,97       ,8        ,            ,           ,-0.2     ,           ,470     ,           ,8         ,-0.71


Using the OOTB CSV inputs, all but 4 of these messages would be dropped because they don't contain the full set of fields.  All of the messages conform to the expected GeoEvent Definition, however some of them are missing the trailing set of fields because there is no updated value for those fields.


Flexible CSV Adapter

To get around this issue I updated the OOTB inbound Text Adapter to be a bit more flexible.  For each CSV message, it will attempt to put each field into the provided GeoEvent definition. If there aren't enough fields in the CSV message to fill the GeoEvent, the remaining fields in the event will have their values set to NULL.  If there are too many fields in the CSV message, the extra fields in the CSV message will be ignored (like if you only wanted the first 5 values in the above example messages).  


Deploying & Compatibility

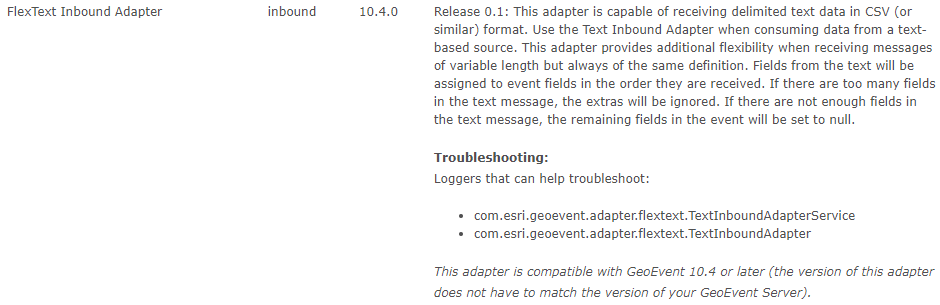
This adapter is compatible with any version of GeoEvent Server 10.4 or later. To deploy, unzip the attached file and either upload the .jar file to GeoEvent Manager on Site > Components > Adapters using the Add Local Adapter button. Alternatively, you can copy the .jar file into the deploy folder of your GeoEvent Server installation (for windows that would typically be C:\Program Files\ArcGIS\Server\GeoEvent\deploy\ ).  The current release is marked version 0.1 (proof of concept). Please report any issues in the comments section of this blog.
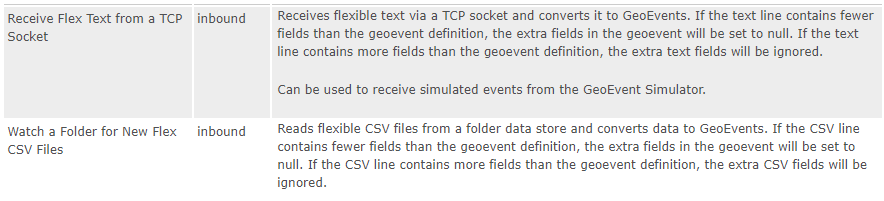
 

Connectors

Adding the .jar file to GeoEvent Server will create two inbound connectors for you. You can create additional connectors utilizing different transports if needed.


Troubleshooting

Loggers that can help troubleshoot:


com.esri.geoevent.adapter.flextext.TextInboundAdapterService
com.esri.geoevent.adapter.flextext.TextInboundAdapter


Source Code

The source code for this adapter is available in the following GitHub repository:

https://github.com/EsriPS/geoevent-flextext-adapter 

more
3 3 736
104 Subscribers