Hi everyone,
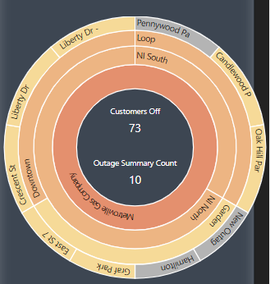
I am currently working on upgrading my WebAppBuilder application to Experience builder which uses Outages data. My web app builder chart looks like Donut(pie) chart of Experience builder. I am able to display single layer data , but I would like to display multilayer data at a time in a Hierarchical view , it looks like below.

Here my chart follows the hierarchy as Company-->Division-->District-->ActiveOutage
Can we display something like this ? Or any other way we can represent like this?
Thanks,
Ashok