- Home
- :
- All Communities
- :
- Products
- :
- ArcGIS Enterprise
- :
- ArcGIS Enterprise Documents
- :
- Create ArcGIS Server Statistics Report
- Subscribe to RSS Feed
- Mark as New
- Mark as Read
- Bookmark
- Subscribe
- Printer Friendly Page
- Report Inappropriate Content
Create ArcGIS Server Statistics Report
Create ArcGIS Server Statistics Report
Use this tool within ArcGIS Desktop/ArcGIS Pro to create an ArcGIS Server statistic report, and a second tool to execute the report writing the output to a CSV file. A great advantage of this tool versus creating the report within ArcGIS Server manager is that you are not limited to one statistic per report.
The following statistics are available for display in a report. You can select multiple statistics and multiple services per report.
- Total requests—Total number of requests made by a client to a service for a given time frame.
- Average response time—Average amount of time ArcGIS Server takes to return the results of a request to a client. The average response time is displayed in seconds.
- Maximum response time—Maximum amount of time ArcGIS Server takes to return the results of a request to a client. The maximum response time displays in seconds.
- Timeouts—Reported service timeouts can occur due to one or a combination of the following:
- Client keeps a service longer than the specified maximum usage time, and the client loses its reference to the service.
- Client's wait time exceeds the maximum wait time specified for a service.
- Maximum running instances—Maximum number of instances running for a particular service over a given time frame.
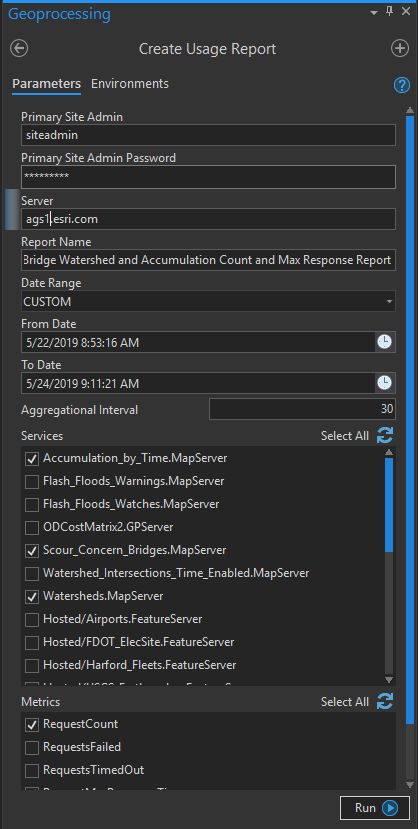
First, you can create a report with the metrics you would like collect, and for which services, using the Create Usage Report tool:
After the report has been created, you can run the Execute Report tool to create a CSV of the statistics:

Example output:

- Mark as Read
- Mark as New
- Bookmark
- Permalink
- Report Inappropriate Content
Hi,
What version of ArcGIS Pro can the Create Usage Report geoprocessing tool be found? I'm using 2.2.3 and I can't find it.
Sean
- Mark as Read
- Mark as New
- Bookmark
- Permalink
- Report Inappropriate Content
It does not look like an OOTB tool. See the attachment at the bottom of the post for the tool download.
- Mark as Read
- Mark as New
- Bookmark
- Permalink
- Report Inappropriate Content
Hello @JakeSkinner , thanks for the tool. I've tried to use it on my ArcGIS Enterprise 10.8 and it's not authenticating. Do you know if it works for this version? Thanks,
Ualas
- Mark as Read
- Mark as New
- Bookmark
- Permalink
- Report Inappropriate Content
@UalasRohrer yes, this tool works at 10.8. Are you authentication using the Primary Site Administrator account?
- Mark as Read
- Mark as New
- Bookmark
- Permalink
- Report Inappropriate Content
Does the tool require the Primary Site Administrator account? Can the tool be run by any account with Administrator privileges?
Thanks,
Bernie.
- Mark as Read
- Mark as New
- Bookmark
- Permalink
- Report Inappropriate Content
@berniejconnorsif ArcGIS Server is not federated with Portal for ArcGIS, then you can use any Administrator account. If ArcGIS Server is federated, then you will need to use the Primary Site Administrator account.
- Mark as Read
- Mark as New
- Bookmark
- Permalink
- Report Inappropriate Content
Where can i find the Create Usage Report tool. The zip filed attached here contains only Execute Report tool.
- Mark as Read
- Mark as New
- Bookmark
- Permalink
- Report Inappropriate Content
@SushilPradhan you need to run the tool in ArcGIS Pro.
- Mark as Read
- Mark as New
- Bookmark
- Permalink
- Report Inappropriate Content
@JakeSkinner I am using ArcGIS Pro 2.6 and unable to find that tool. Appreciate for your advise!
- Mark as Read
- Mark as New
- Bookmark
- Permalink
- Report Inappropriate Content
@SushilPradhan I could not reproduce this with ArcGIS Pro 2.8.3. I developed this tool at a much earlier version than ArcGIS Pro 2.8, so 2.6 should work. I would try one of the following:
- Upgarde ArcGIS Pro to 2.8
- Re-download the tool
- Mark as Read
- Mark as New
- Bookmark
- Permalink
- Report Inappropriate Content
@JakeSkinner Thanks for that. I have managed to work it out and able to generate some reports. I have another question in relation to the usage report if you can make help me.
I have generated a report on Services Max Running Instances for a service, for instance, BLE_Aug18 in the left side of the diagram below (highlighted in Yellow). As you can see, the minimum and maximum instances allocated for this service are 4 and 8. Whereas on the right side of the diagram, the graph shows the max instance running for this service is just 1. Not sure how is that is possible while min instance is set to 4. We have 4 ArcGIS Server running, so does that mean, the max instances showing in the graph is representing for each server? When i generated report for ALL servers or for individual server, it's always returning just 1. If you can make it clear how this works or what could be situation here would be really helpful. I tried to find some help documents in ESRI site, but couldn't find any useful explanation.

- Mark as Read
- Mark as New
- Bookmark
- Permalink
- Report Inappropriate Content
@JakeSkinner This is a really useful toolset, but does anyone already have an elegant way of displaying their CSV in a dashboard or infographics? This CSV had PowerBI or Dashboard written all over it, but it's beyond my expertise at this stage
- Mark as Read
- Mark as New
- Bookmark
- Permalink
- Report Inappropriate Content
Jake,
Have you tried System Log Parser? It creates a nicely formatted Excel report with more info than the tool you mentioned.
Bernie.
- Mark as Read
- Mark as New
- Bookmark
- Permalink
- Report Inappropriate Content
@JakeSkinner Does this work with Pro 3.1.1? I keep getting several errors ties to the username when all the information entered is correct. Any insight to help work through this?
- Mark as Read
- Mark as New
- Bookmark
- Permalink
- Report Inappropriate Content
@Meghan_CityofDayton can you send a screen shot of the error you are receiving? Also, are you using the Primary Site Administrator account? Even if Server is federated with Portal you will want to use the PSA account.
