- Home
- :
- All Communities
- :
- Products
- :
- ArcGIS Dashboards
- :
- ArcGIS Dashboards Questions
- :
- how to organize data to be displayed as indicator ...
- Subscribe to RSS Feed
- Mark Topic as New
- Mark Topic as Read
- Float this Topic for Current User
- Bookmark
- Subscribe
- Mute
- Printer Friendly Page
how to organize data to be displayed as indicator in an operations dashboard
- Mark as New
- Bookmark
- Subscribe
- Mute
- Subscribe to RSS Feed
- Permalink
- Report Inappropriate Content
Hi folks,
the options you have in the operations dashboard to display data are really plenty. I like the documentation on Indicator data Indicator—Operations Dashboard for ArcGIS | Documentation but was wondering how do I need to store the data actually if I want to display them like in the last example with the raise or drop compared to the last day (or year in my case).
I have for example Green house gas emissions for 2006 to 2015 for a country (plus a couple of other data in that context). For each year I have the current value and the difference to the previous year as well as the difference compared to 2006. At the moment I have the data stored duplicating the polygon of my country having for each year a polygon and then the actual data as attributes per year.
I have seen that I can use different data sources for my reference value but none of these options would allow me to select the value of the previous year as it is stored in a separate feature.
Any hint how to better organize my data to make use of this functionality?
Solved! Go to Solution.
Accepted Solutions
- Mark as New
- Bookmark
- Subscribe
- Mute
- Subscribe to RSS Feed
- Permalink
- Report Inappropriate Content
Hi Sarah,
I finally figured it out with some Esri help 🙂 (at least partly)
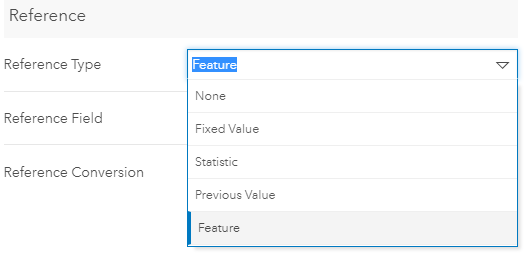
In the reference area I need to use statistics, then filter for the reference year (in my case 2006) and select the field with the value I want to use as reference.
I managed to show data as in your example using the filter "today" for the main indicator and "yesterday" for the reference value but I still didn't figure out how it would work if the last value is not today but maybe last week and I want to compare to the previous week... .
I hope that helps already a bit...
- Mark as New
- Bookmark
- Subscribe
- Mute
- Subscribe to RSS Feed
- Permalink
- Report Inappropriate Content
I have this same question. I would also like to know if it's possible to compare the top two values of the same field if they're sorted by date or another field, using the second value as the "previous value" or the reference value. Example data set:
Measure --> Date --> Value
911 Emergency Calls --> 09/21/2019 --> 110
911 Emergency Calls --> 09/20/2019 --> 115
911 Emergency Calls --> 09/19/2019 --> 210
911 Emergency Calls --> 09/18/2019 --> 91
In the example data set above, we'd like to have an indicator on our dashboard that uses the previous day's value as the reference number to indicate whether today's volume is up or down from yesterday's volume. However, the previous value option in the reference field does not work like this. Is there a way to do this?
- Mark as New
- Bookmark
- Subscribe
- Mute
- Subscribe to RSS Feed
- Permalink
- Report Inappropriate Content
Hi Sarah,
I finally figured it out with some Esri help 🙂 (at least partly)
In the reference area I need to use statistics, then filter for the reference year (in my case 2006) and select the field with the value I want to use as reference.
I managed to show data as in your example using the filter "today" for the main indicator and "yesterday" for the reference value but I still didn't figure out how it would work if the last value is not today but maybe last week and I want to compare to the previous week... .
I hope that helps already a bit...
- Mark as New
- Bookmark
- Subscribe
- Mute
- Subscribe to RSS Feed
- Permalink
- Report Inappropriate Content
Thanks Nicole,
That's actually something I've tried using, and just filtering for a little older than the date used in the data portion of the indicator. However, without a sort option in the reference area and a way to pull just one feature like in the data part above, it makes this option much more limited in use. But, for situations where the user is using a year to date total as a reference, or if the data is always able to be filtered down to one value, using the statistics option in a reference will work.
- Mark as New
- Bookmark
- Subscribe
- Mute
- Subscribe to RSS Feed
- Permalink
- Report Inappropriate Content
I totally agree Sarah! David (https://community.esri.com/thread/246919-most-recent-feature-in-indicator-widget ) explained that the previous option allows to use self-refreshing data (e.g. automatically updated number of accidents) to show previous statistics. I was thinking that the Previous option would allow to automatically use the previous value from the table defined by a certain field. Maybe that would be worth an Idea?