- Home
- :
- All Communities
- :
- Products
- :
- ArcGIS Dashboards
- :
- ArcGIS Dashboards Questions
- :
- Re: Data comparison by adjustable date
- Subscribe to RSS Feed
- Mark Topic as New
- Mark Topic as Read
- Float this Topic for Current User
- Bookmark
- Subscribe
- Mute
- Printer Friendly Page
Data comparison by adjustable date
- Mark as New
- Bookmark
- Subscribe
- Mute
- Subscribe to RSS Feed
- Permalink
- Report Inappropriate Content
I have an Operations Dashboard that shows crime data. I want to be able to compare one time frame to the previous time frame based on a filter condition selected by the user.
For example, if the user selects "One Week" as the time frame they want to see the indicator will show if crime is up or down from the previous week. If they choose "One Month" it'll show compared to the previous month.... etc.
I'm trying to figure out how I could set up my conditional formatting to have this variable time frame comparison.
Has anyone else worked on something similar?
- Mark as New
- Bookmark
- Subscribe
- Mute
- Subscribe to RSS Feed
- Permalink
- Report Inappropriate Content
I'd love something similar...
- Mark as New
- Bookmark
- Subscribe
- Mute
- Subscribe to RSS Feed
- Permalink
- Report Inappropriate Content
Andrew,
The current work around I'm doing is having a few indicators showing a predetermined time frame.....
I'm not sure if you've tried something similar but just tossing out ideas.
- Mark as New
- Bookmark
- Subscribe
- Mute
- Subscribe to RSS Feed
- Permalink
- Report Inappropriate Content
Thanks Brandon Jumonville
How are you getting that % value in the middle of your indicator?
- Mark as New
- Bookmark
- Subscribe
- Mute
- Subscribe to RSS Feed
- Permalink
- Report Inappropriate Content
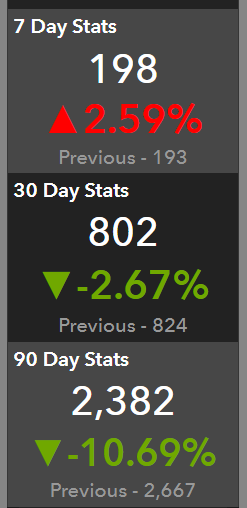
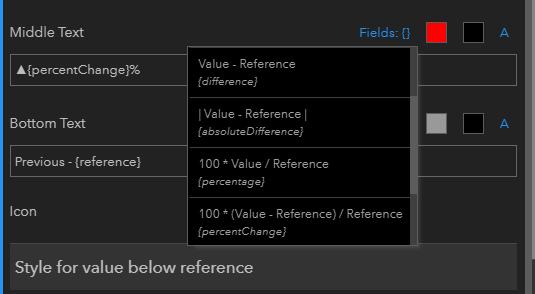
Andrew,
I'm creating a "Reference" that compares the previous time frame to the current (last 30 days referencing last 60 to 30 days). The option to use a reference is at the bottom of the Data pane (it took me a while to find it because I was just kind of glossing over it)/

You are given several more options in the "Fields: {}" after setting a reference
And this was the layout I decided on after playing around with it a bit.
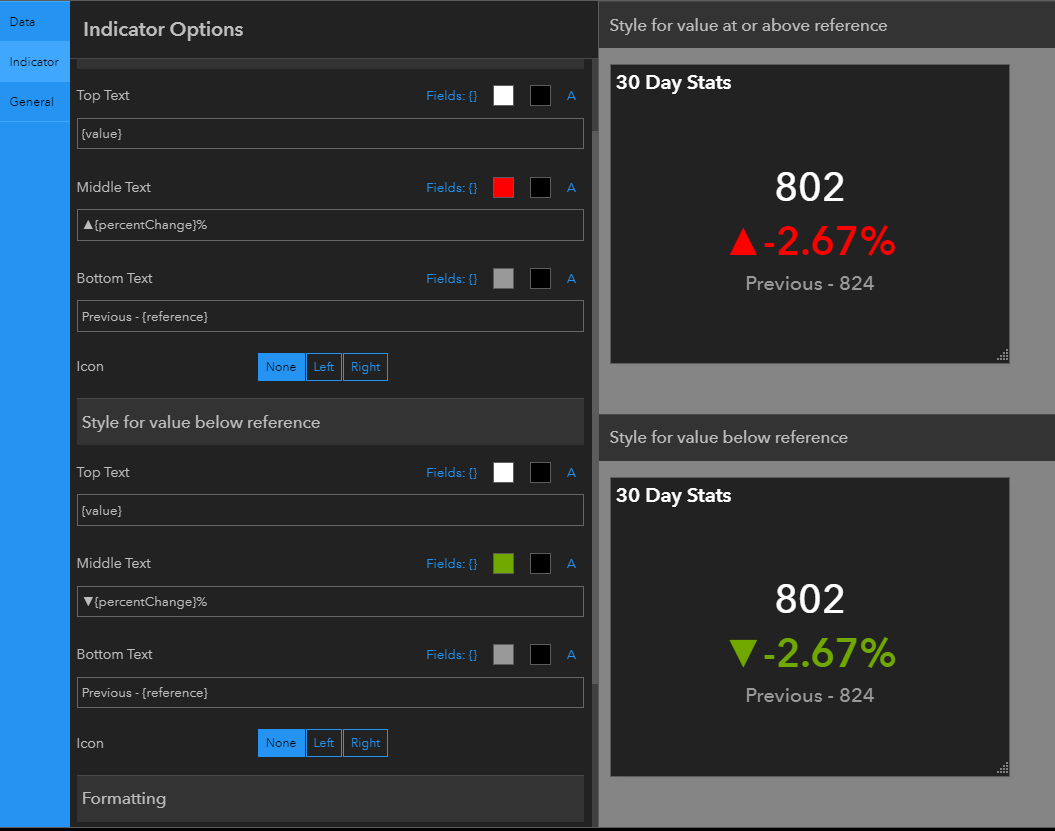
I hope that helps.
- Mark as New
- Bookmark
- Subscribe
- Mute
- Subscribe to RSS Feed
- Permalink
- Report Inappropriate Content
I am looking for similar functionality. Is creating multiple indicators still the only way? Has someone found out how to do this with a serial chart? If not, did you submit it as and idea?
https://community.esri.com/t5/arcgis-dashboards-ideas/idb-p/arcgis-dashboards-ideas
- Mark as New
- Bookmark
- Subscribe
- Mute
- Subscribe to RSS Feed
- Permalink
- Report Inappropriate Content
Hello, I am trying to create something similar but comparing periods of time. For example, I want to be able to compare this January with the previous January. However, I need to give the user the option of selecting what period of time they want to visualize. I am trying to visualize it preferably in a graph. Is this possible?
- Mark as New
- Bookmark
- Subscribe
- Mute
- Subscribe to RSS Feed
- Permalink
- Report Inappropriate Content
I would think this is possible with bit of finesse. If you are wanting to compare this January to last January, or even January from a few years back, you may need to create additional field(s) that call out the specific month, or even days if you want to compare that level of detail. Then you could have predefined months, days, years, etc. that filter two different serial charts. Hope this helps.