- Home
- :
- All Communities
- :
- Products
- :
- ArcGIS Dashboards
- :
- ArcGIS Dashboards Questions
- :
- Can you synchronize the scrollbar for 2 series cha...
- Subscribe to RSS Feed
- Mark Topic as New
- Mark Topic as Read
- Float this Topic for Current User
- Bookmark
- Subscribe
- Mute
- Printer Friendly Page
Can you synchronize the scrollbar for 2 series charts?
- Mark as New
- Bookmark
- Subscribe
- Mute
- Subscribe to RSS Feed
- Permalink
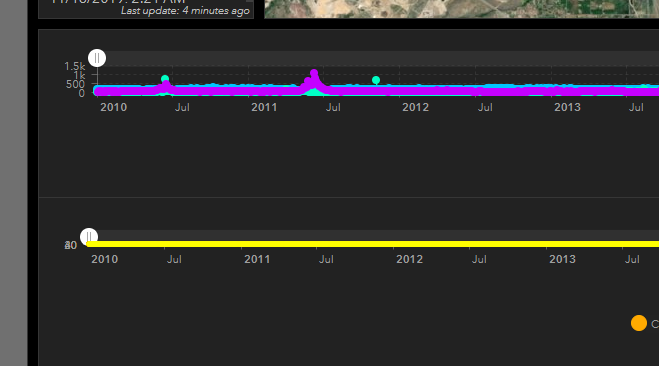
I have two series charts docked into one window in a dashboard. They look good when the chart is first generated but if I use the scroll bar on one, they get out of sync.
Is it possible to synchronize the scrollbar so the x axes of both charts are adjusted simultaneously? I'd like these 2 charts to be in sync. I need 2 charts because the result units are different for the items in each chart and they don't work well on the same chart.
Thank you,
Randy McGregor
- Mark as New
- Bookmark
- Subscribe
- Mute
- Subscribe to RSS Feed
- Permalink
Hi Randy,
> Is it possible to synchronize the scrollbar so the x axes of both charts are adjusted simultaneously? I'd like these 2 charts to be in sync.
This functionality is not possible in Ops Dashboard. Can you please post an enhancement request on the ArcGIS Ideas site for Ops Dashboard so we can gauge interest from the community?
Hope this helps,