Turn on suggestions
Auto-suggest helps you quickly narrow down your search results by suggesting possible matches as you type.
Cancel
- Home
- :
- All Communities
- :
- Products
- :
- ArcGIS Dashboards
- :
- ArcGIS Dashboards Questions
- :
- Can you combine survey results via a grouped seria...
Options
- Subscribe to RSS Feed
- Mark Topic as New
- Mark Topic as Read
- Float this Topic for Current User
- Bookmark
- Subscribe
- Mute
- Printer Friendly Page
Can you combine survey results via a grouped serial chart in ArcGIS Dashboards?
Subscribe
702
1
08-09-2021 06:09 PM
by
Anonymous User
Not applicable
08-09-2021
06:09 PM
- Mark as New
- Bookmark
- Subscribe
- Mute
- Subscribe to RSS Feed
- Permalink
- Report Inappropriate Content
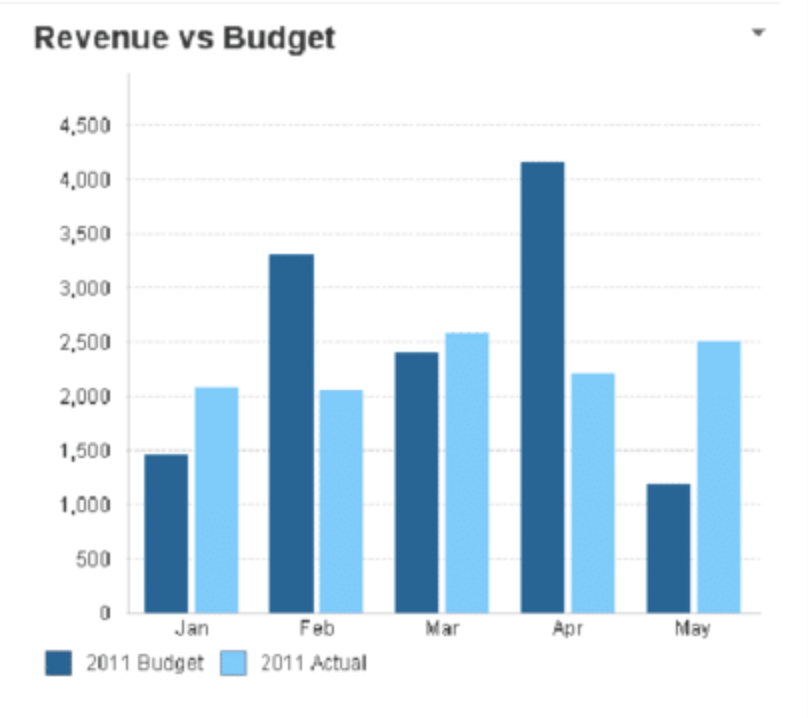
I have two surveys which consists of several agree/disagree questions. They are the same questions, only one survey is a "before" survey and the other suvery is an "after" survey. Is there a way to create a grouped serial chart showing the before/and after as two different bars on the same chart?
I've attached an example. So the dark blue would be the results from the "before" survey and the light blue would be from the "after" survey.
1 Reply
08-10-2021
06:38 AM
- Mark as New
- Bookmark
- Subscribe
- Mute
- Subscribe to RSS Feed
- Permalink
- Report Inappropriate Content
Yes! But you'll need to use a Data Expression in order to bring in data from separate layers. The sample expressions can get you started, but you can find other examples on other Community posts if you look for them.
- Josh Carlson
Kendall County GIS
Kendall County GIS